- To calculate the power following an analysis of variance, click Further output then click Power calculations.
When assessing an experimental design, it can be useful to know how likely a treatment response of a specified size may be detected. This probability of detection, known as the power of the design with respect to the response of interest, helps to determine whether the experiment is sufficiently large or accurate to achieve its purpose.
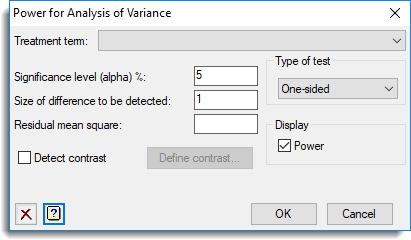
Treatment term
A list of the treatment terms in the current design. The calculated power will be for a difference between two means in this treatment means table.
Significance level (alpha)%
Significance level as a percentage (0-100) at which the response is required to be detected; default 5%.
Size of the difference to be detected
Size of the difference between the treatment effects that is to be detected.
Residual mean square
The residual mean square expected for the stratum that contains the selected treatment term. If this field is left blank the residual mean square from the current analysis will be used. Alternatively, you can supply a value obtained from a previous analysis.
Detect contrast
Calculate the power of a specified contrast between means in the treatment terms. The specified contrast is set by clicking Define contrast, which opens a menu where you can define a contrast variate.
Type of test
Specifies the type of test. You can select to use a One-sided or Two-sided t-test. Alternatively, if you select F-ratio the menu takes the size of difference to be the maximum difference between the effects of treatment term, and uses an F-test. The other settings enable you to test for Equivalence or for Non-inferiority. With equivalence, the size of difference provides a threshold below which the treatments can be assumed to be equivalent. For example, if the treatments have effects e1 and e2, the null hypothesis that the treatments are not equivalent is that either:
(e1 – e2) ≤ – size of difference
or
(e1 – e2) ≥ – size of difference
with the alternative hypothesis that they are equivalent, i.e.
-size of difference < (e1 – e2) < size of difference
With non-inferiority, the size of difference again specifies the threshold for the effect of one treatment to be superior to another. So, for example, to demonstrate non-inferiority of treatment 1 compared to treatment 2, the null hypothesis becomes:
(e1 – e2) ≥ -size of difference
which represents a simple one-sided t-test.
Display
Specifies which items of output are to be displayed in the Output window.
| Power | Displays the probability of detection (power) |
Action buttons
| OK | Calculates the power and displays the result in a dialog. Clicking OK on this dialog closes both the result and Power dialogs returning to the Further output dialog. Clicking the Change button returns you to the Power dialog. |
| Cancel | Close the dialog without further changes. |
See also
- Define contrast variate menu for creating contrasts
- APOWER procedure for calculating the power for an analysis of variance using the command language