Use this to display the fit of an HGLM. It displays the fitted model in one or two dimensions. It usually also displays the observed response values, adjusted for any other explanatory terms in the model, but these can be omitted.
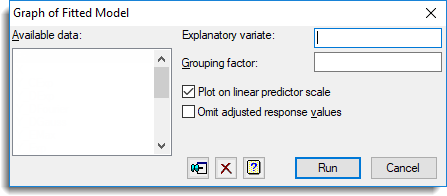
Available data
This lists data structures appropriate to the current input field. It lists either factors for use in specifying grouping factor, or variates for specifying the explanatory variate. The contents will change as you move from one field to the next. Double-click a name to copy it to the current input field or type the name.
Explanatory variable
Specifies an explanatory variable from the fixed model to be used in the plot.
Grouping factor
Specifies a grouping factor from the fixed model to be used in the plot.
Plot on linear predictor scale
Specifies whether to plot the fitted relationship on the original scale, or to use the scale of the linear predictor.
Omit the adjusted response values
The graph displays the observed response values, adjusted for any other explanatory terms in the model, but these can be omitted by selecting this option.
Action Icons
| Pin | Controls whether to keep the dialog open when you click Run. When the pin is up |
|
| Clear | Clear all fields and list boxes. | |
| Help | Open the Help topic for this dialog. |
See also
- HGGRAPH procedure for displaying the fit of a HGLM.