Select menu: Data | Interpolation
Interpolation fits a piecewise line or curve through a set of points, then predicts values at intermediate values of x or y using the fitted curve. The values to interpolate must be at points within the range of the given x or y data. If the interpolating curve is Y=F(X), then for a given x, we obtain the interpolated value y = F(x). For inverse interpolation, for a given y, x is found, such that y = F(x), if possible. Two smoothing functions are provided. These do not give a curve that passes through every point, but smooth out random variation around a smooth trend which best fits the data for a given degree of flexibility. This allows predictions to be estimated with reduction in the random variation from point to point.
- After you have imported your data, from the menu select
Data | Interpolation.
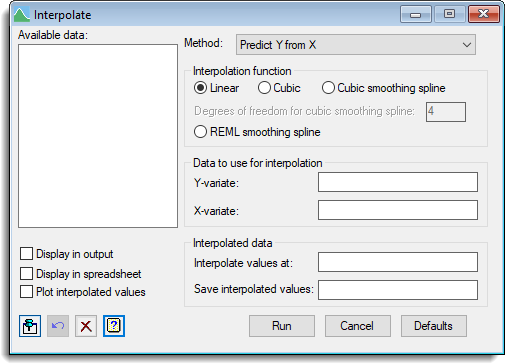
Available data
Lists variates that are currently available. Double-click a name to copy it into the edit field or type the name.
Method
This defines the type of interpolation.
| Predict Y from X | given the x-values, predict the y-values by interpolation. |
| Predict X from Y | given the y-values, predict the x-values by inverse interpolation. |
| Predict missing values in both Y and X | Predict values for the missing observations within both the x and y variates. If a y-value is missing the corresponding x-value is used to interpolate the missing y-value, and vice-versa for missing x-values. |
Interpolation function
This defines the type of curve fitted to the points in the original series.
| Linear | a straight line joins the points in a piecewise linear function. |
| Cubic | a cubic polynomial is fitted through the 4 points around each interval. |
| Cubic smoothing spline | a cubic smoothing spline with the specified degrees of freedom is fitted to the series using the FIT command. |
| REML smoothing spline | a REML smoothing spline is fitted to the points, where the amount of smoothing is estimated as a variance component. |
Data to use for interpolation
These two fields define the points in the series being interpolated from.
| Y-variate | variate containing the y-values in the data. |
| X-variate | variate containing the x-values in the data. |
Interpolated data
Provides fields to specify the values to interpolate at and save the resulting values. These fields are only available when either the Predict Y from X or Predict X from Y methods are selected. The values to interpolate at can be supplied within a variate, as an individual number or a series of numbers separated by spaces or commas (e.g. 1 3.5 5.8 or 1,3.5,5.8).
| Interpolate values at | contains the known x- or y-values where the y- or x-values will be interpolated at. |
| Save interpolated values | a name of a variate to save the interpolated values. |
Display in output
When selected, the interpolated values will be displayed in the Output window.
Display in spreadsheet
When selected, the interpolated values will be displayed in the spreadsheet. If the variate specified in the Interpolate values at field is currently open within a spreadsheet, then the values will be added to that spreadsheet, otherwise a new spreadsheet will be created.
Plot interpolated values
When selected, a graph will be created showing the interpolated points and the data used for interpolation.
See also
- INTERPOLATE directive
- VINTERPOLATE procedure
- FIT directive
- REML directive
- Calculations menu
- Smoothing spline regression menu
- Linear mixed models (REML) menu
- Data Menu