Use this to set options for normalizing two channel microarray data.
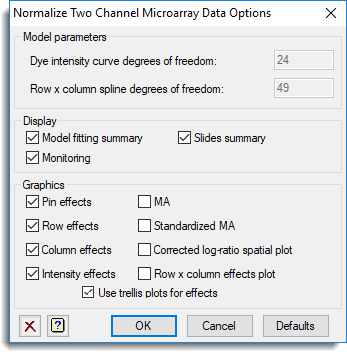
Model parameters
These terms set the flexibility of the spline or loess curves used in the normalization model.
Dye intensity curve degrees of freedom
The number of degrees of freedom in the curve (spline or loess) relating spot brightness on the log 2 scale (intensity) and the log-ratios. Increasing this value will make the curve more flexible, but will increase the time to fit the model, and may over fit the relationship. This value must be greater than 3.
Row x column spline degrees of freedom
The number of degrees of freedom in the spatial surface fitted to the slide. Increasing this value will make the surface more flexible, but will increase the time to fit the model, and may over fit the relationship. This value must be between than 16 and 400.
Display
This specifies which items of output are to be produced by the analysis.
| Model fitting summary | A detailed summary of the model fitted to each slide: the parameters and significance of the terms in the model |
| Monitoring | Timing and optimization progress of the model fitting. |
| Slides summary | A single line summary of the model fitted to each slide |
Graphics
Controls whether to display different graphs for each slide.
| Pin effects | The fitted pins effects vs pin number for each slide. |
| Row effects | The fitted rows effects vs row number for each slide. |
| Column effects | The fitted columns effects vs column number for each slide. |
| Intensity effects | The fitted intensity curve for each slide. |
| MA | The log-ratio vs intensity plot for each slide. |
| Standardized MA | The corrected and standardized log-ratio vs intensity plot for each slide. The corrected log-ratios are standardized by smoothing the variances of the log-ratios over intensity and then dividing the corrected log-ratios by their standard deviations equal to square root of the smoothed variances. |
| Corrected log-ratio spatial plot | The log-ratio on the grid in a shade plot. |
| Row x column effects | A shade plot of the thin-plate spline surface fitted to the rows by columns interaction. |
| Use trellis plots for effects | The effects plots for all slides will be plotted in a single trellis plot, with slides shown in the heading of each panel. |
Action buttons
| OK | Save the options settings and close the dialog. |
| Cancel | Close the dialog without making any changes. |
| Defaults | Reset the options to their default settings. |
Action Icons
| Clear | Clear all fields and list boxes. | |
| Help | Open the Help topic for this dialog. |