Select menu: Stats | Six Sigma | Pareto Charts
This menu sorts tables so that their margins are in a specified order. With a multi-way table, for example, this may help in interpreting an interaction from an analysis of variance. With a one-way table, it allows the cells to be displayed in ascending order, as in a Pareto chart.
Note: The Table Sort menu does the same procedure, but displays the new table as a spreadsheet rather than a graph.
- After you have imported your data, from the menu select
Stats | Six Sigma | Pareto Charts. - Fill in the fields as required then click Run.
You can set additional options by clicking Options.
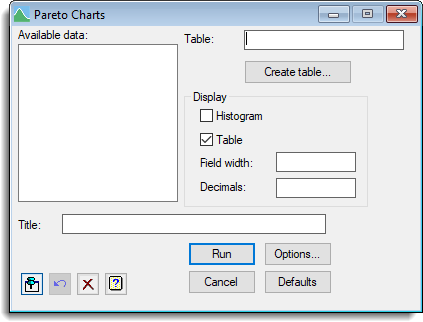
Available data
This lists data structures appropriate to the current input field. The contents will change as you move from one field to the next. Double-click a name to copy it to the current input field or type the name.
Table
Species a table containing the data.
Create table
Lets you create a table by using existing factors and variates.
Display
Specifies the output to be displayed.
| Histogram | Plots one or two-way tables in a histogram. |
| Table | Displays the table. The fieldwidth and decimal places used for the cells within the table can be provided in the spaces provided. |
Title
Specify a title to be used in the display of each table.
Action Icons
| Pin | Controls whether to keep the dialog open when you click Run. When the pin is down |
|
| Restore | Restore names into edit fields and default settings. | |
| Clear | Clear all fields and list boxes. | |
| Help | Open the Help topic for this dialog. |
See also
- Pareto Chart Options
- Table Sort
- TABSORT procedure