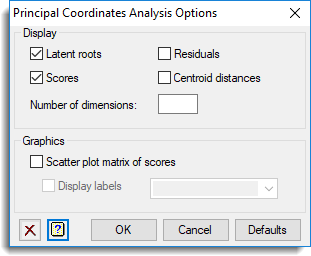
Use this to select the output to be generated by a principal coordinates analysis and options used in the analysis.

Display
Specifies which output should be displayed by a principal coordinates analysis.
| Latent roots | Latent roots (eigenvalues) |
| Scores | Scores (fitted coordinates) |
| Residuals | Residuals |
| Centroid distances | Distances of the n points from the centroid of the configuration |
Number of dimensions
Specifies how many latent roots and vectors are displayed (and saved); the residuals are formed from the remaining dimensions.
Graphics
Specifies graphical display of the results from the analysis.
| Scatter plot of matrix scores | Draws a scatter plot matrix of the scores. The number of dimensions displayed in the plot will be equal to that specified above. |
| Display labels | Specify a text containing labels for the individual points displayed in the plots. The text should be equal in length to the data variates. |