Use this to specify options for a single trait association analysis in single environment trials.
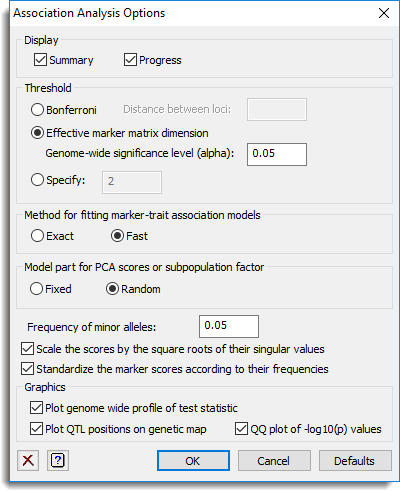
Display
This specifies which items of output are to be produced by the analysis.
| Summary | Produces a summary of the QTLs that are retained in the model |
| Progress | Produces monitoring output detailing the progress of the analysis |
Threshold
Specifies the threshold method to use. Select Bonferroni for the Bonferroni method, which assumes independent tests occur at a fixed distance on the genome, where this distance must be supplied in the space provided. The Effective marker matrix dimension method first determines the effective number of columns (nC) in the marker matrix data and calculates the threshold as -log10(alpha/nC). The parameter alpha is the genome-wide type I error rate specified using the genome-wide significance level (alpha) option. Alternatively, select Specify to supply your own threshold value on the -log10 scale in the space provided.
Method for fitting marker-trait association models
This defines the method to use to fit marker-trait association models, either Exact or Fast. For the exact method, the mixed models are solved for each marker separately. For the fast method, the mixed model is only solved for the genetic background model, without the markers in the model. The estimated variance-covariance matrix from this genetic background model is used to perform a generalized least squares scan for all the marker. The fast method is implemented only for bi-allelic markers, such as SNPs.
Model part for PCA scores or subpopulation factor
Specifies whether the principal components scores when using an eigenanalysis relationship model or the subpopulations factor when using a subpopulations relationship model are included as Random or Fixed terms.
Frequency of minor alleles
Specify the frequency q below which alleles are considered rare. Rare alleles are automatically pooled together. Markers whose major frequency allele is greater than or equal to 1-q are considered close to fixation and are not used in the analysis.
Scale the scores by the square roots of their singular values
When selected the marker scores are scaled by the square roots of their singular values.
Standardize the marker scores according to their frequencies
When selected the marker scores are standardized according to their frequencies.
Graphics
This specifies whether plots are to be produced by the analysis.
| Plot genome wide profile of the test statistic | Plots a genome wide profile of the test statistic. |
| Plot QTL positions on genetic map | Plots the significant QTLs on a genetic map. |
| QQ plot of the -log10(p) values | Produces a QQ plot of the -log10(p) values. |
Action buttons
| OK | Stores the option settings and closes the dialog. |
| Cancel | Close the dialog without making any changes. |
| Defaults | Sets the options to their default settings. |
Action Icons
| Clear | Clear all fields and list boxes. | |
| Help | Open the Help topic for this dialog. |
See also
- Single trait association analysis (single environment) menu.
- Single trait association analysis (multiple environments) menu.
- QSASSOCIATION and QMASSOCIATION procedures in command mode