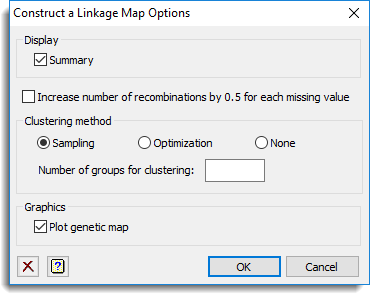
Use this to specify options for constructing a linkage map.

Display
This specifies which items of output are to be produced by the analysis.
| Summary | Produces a summary of the number of linkage groups and the minimum, mean and maximum of the positions per linkage group. |
Increase numbers of recombinations by 0.5 for each missing value
Specifies whether the number of recombinations is increased with 0.5 recombination for each missing value.
Clustering method
This specifies the type of spatial clustering used to obtain a framework map. You can select between the Sampling and Optimization for the clustering method or select None for no spatial clustering. Note that for a CP population the sampling method is not available. The number of groups to be used in the clustering can be specified using the Number of groups for clustering option. If this field is left blank then for the population types DH, BC1, F2 and RIL a default of 10 groups is used which leads to recombination frequencies between the markers that form cluster centres of about 0.1. The cluster centres are used to obtain a framework map. Similarly, for a CP population 25 groups are used by default.
Graphics
This specifies which items of graphical display are to be produced.
| Plot genetic map | Produces a plot of the genetic map . |
Action buttons
| OK | Stores the option settings and closes the dialog. |
| Cancel | Close the dialog without making any changes. |
| Defaults | Sets the options to their default settings. |
Action Icons
| Clear | Clear all fields and list boxes. | |
| Help | Open the Help topic for this dialog. |
See also
- Construct a linkage map menu.
- QMAP procedure in command mode