
Use this to select the output and graphs to be generated by a rainfall analysis.
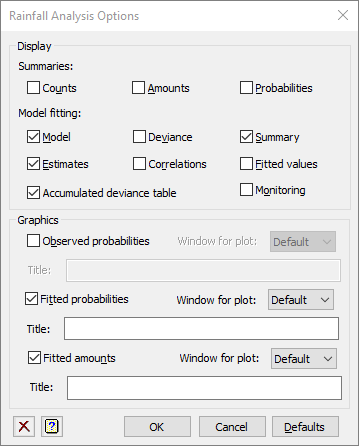
Display
| Counts | A table of counts for each day in the year by each Markov state |
| Amounts | A table of the mean rainfall amounts for each day in the year by each wet Markov state |
| Probabilities | A table of the rainfall probabilities for each day in the year by each wet Markov state |
| Model | Details of the model fitted |
| Deviance | The deviance of the fitted model |
| Summary | Summary analysis-of-variance |
| Estimates | Estimates of the parameters in the model |
| Correlations | Correlations between the parameter estimates |
| Fitted values | Table containing the values of the response variate, the fitted values, standardized residuals and leverages |
| Accumulated | Analysis of deviance table containing a line for each harmonic term in the fitted model |
| Monitoring | Monitoring information from the fitting process |
Graphics
Selecting these options will produce graphs of the observed rainfall probabilites and the fitted models for rainfall probabilities and mean amounts. The title and window for each graph can be specified in the Title and Window for plot fields respectively.
| Observed probabilities | A graph of the observed probabilities of rainfall plotted against day in the year for each wet Markov state |
| Fitted probabilities | A graph of the fitted probabilities of rainfall plotted against day in the year for each wet Markov state |
| Fitted amounts | A graph of the fitted mean rainfall plotted against day in the year for each wet Markov state |
Note: the observed rainfall probabilities are the number of wet days divided by the total days observed for a given calendar date, so if in a 40 year record it had rained 10 times on the 23 February, then its rainfall probability would be 10/40 = 0.25.
Action buttons
| OK | Save the settings and close the dialog. |
| Cancel | Close the dialog without further changes. |
| Defaults | Reset the options to their default settings. |
See also
- Rainfall Analysis menu
- Rainfall Analysis Store Options dialog
- RFSUMMARY procedure in command mode
- RFFPROBABILITY procedure in command mode
- RFFAMOUNT procedure in command mode