Select menu: Stats | Repeated Measurements | Analysis of Variance
Produces an analysis of variance for repeated measurements. A repeated-measures design is one in which subjects (animals, people, plots, etc.) are observed several times. Each subject receives a randomly allocated treatment, either at the outset, or repeatedly through the experiment. The subjects are observed at successive occasions to see how the treatment effects develop.
- After you have imported your data, from the menu select
Stats | Repeated Measurements | Analysis of Variance. - Fill in the fields as required then click Run.
You can set additional Options then after running, you can save the results by clicking Save.
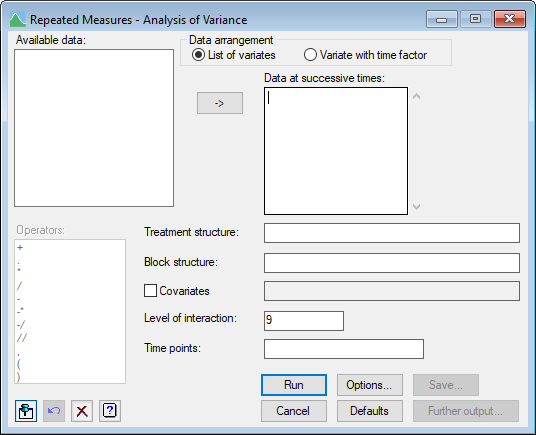
Available data
This lists data structures appropriate to the current input field. It lists either factors for use in specifying the treatment and block structure, or variates for specifying the data and additional covariates. The contents will change as you move from one field to the next. Double-click a name to copy it to the current input field or type the name.
Data arrangement
You can supply data in either of the following formats:
| List of variates | All the y-variates can be specified in a list. |
| Variate with time factor | A single variate containing all the times can be specified with a time factor of the same length in the Time factor field. |
Data at successive times
Use this to enter the names of the variates, one for each time point, containing the data observations which are to be analysed.
Treatment structure
Specify the treatment terms to be fitted by entering a model formula.
Block structure
The underlying structure of the design is defined by entering a model formula.
Operators
This provides a quick way of entering operators in the treatment and block model formulas. Double-click the required symbol to copy it to the current input field. You can also type in operators directly. See model formula for a description of each.
Covariates
Select the check box if you want to perform analysis of covariance. The adjacent field will become enabled to let you supply a list of the covariates for the analysis. If there is more than one, their names must be separated by spaces or commas.
Level of Interaction
Controls the maximum order of interaction to be generated when you use model-formula operators like *. The default is to include all interactions, up to those involving nine factors. (You cannot ask for more than nine.)
Time points
Specifies a variate or a text for time points that are used to identify the data variates. If the time points are not supplied then the data variates will be identified in the output by their identifier names.
Action buttons
| Run | Run the analysis. |
| Cancel | Close the dialog without further changes. |
| Options | Opens a dialog where you can specify additional options and settings for the graph. |
| Defaults | Resets options back to the default settings. Clicking the right mouse on this button produces a shortcut menu where you can choose to set the options using the currently stored defaults or the Genstat default settings. |
| Save | Opens a dialog where you can save results from the analysis. |
| Further output | Opens a dialog where you can display further output and produce residual plots. |
Action Icons
| Pin | Controls whether to keep the dialog open when you click Run. When the pin is down |
|
| Restore | Restore names into edit fields and default settings. | |
| Clear | Clear all fields and list boxes. | |
| Help | Open the Help topic for this dialog. |
See also
- Options for choosing which results to display
- Save for choosing which results to save
- Further Output for displaying output and producing residual plots
- Save ANOVA results in a spreadsheet
- ANOVA Equivalence Test
- AREPMEASURES procedure