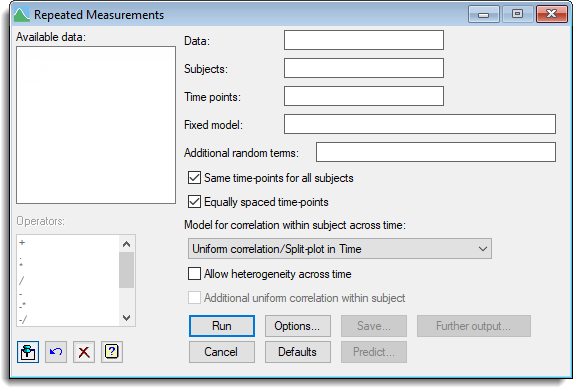
Select menu: Stats | Mixed Models (REML) | Repeated Measurements | Data in One Variate
This dialog provides facilities for repeated measurements analysis using the method of residual maximum likelihood (REML), which is also sometimes called restricted maximum likelihood. The dialog expects the measurements to be within a single variate, with factors to specify the measurements for each subject and the time when the measurements took place.
- After you have imported your data, from the menu select
Stats | Mixed Models (REML) | Repeated Measurements | Data in One Variate.
OR
Stats | Repeated Measurements | Correlation Models by REML | Data in One Variate. - Fill in the fields as required then click Run.
You can set additional Options then after running, you can save the results by clicking Save.

Available data
This lists data structures appropriate to the current input field. The contents will change as you move from one field to the next. Double-click on a name to copy it to the current input field or type the name.
Data
Specifies a data variate containing all the measurements to be analysed.
Subjects
A factor specifying the subjects or individuals.
Time points
A factor specifying the time points for the observations for the subjects.
Fixed model
This gives the fixed model that describes imposed treatment factors and covariates for which the effect of specified levels or values are of interest. The model is described using a formula, which can combine main effects and interactions of factors and also covariates.
Additional random terms
A formula specifying random model terms, additional to the subjects and times, which are to be fitted in the repeated measures model.
Same time-points for all subjects
Specifies whether the time points are the same for every subject. The available types of correlation model that can be fitted will differ according to whether the subjects have the same time-points or not.
Equally spaced time-points
Specifies whether the times of measurement are equally spaced or irregular. The available types of correlation model that can be fitted will differ according to whether the time points are equally spaced or irregular.
Model for correlation within subject across time
Lists the available correlation models that can be fitted. The types of models available will depend on the form of the repeated measurements i.e. whether the time-points are equally spaced or whether the time-points are the same for all subjects.
Allow heterogeneity across time
For the models defined in terms of correlation matrices, that is, the AR, uniform, power and ante-dependence models, it may sometimes be desirable to allow for unequal variances. Select this options to allow heterogeneity across time.
Additional uniform correlation within subject
Specifies whether you want to include additional uniform correlation within subject into the model. This is equivalent to including a random term for subjects, i.e. it adds a term for between-subject variation, which imposes an additional correlation between the observations within each subject. This is the same as what happens in an ordinary randomized-block design – fitting the block term says that the pair of plots within the same block are more similar i.e. have a larger correlation than a pair from different blocks.
Operators
This provides a quick way of entering operators in the fixed model formula. Double-click on the required symbol to copy it to the current input field. You can also type in operators directly. See model formula for a description of each.
Action buttons
| Run | Run the analysis. |
| Cancel | Close the dialog without further changes. |
| Options | Opens a dialog where additional options and settings can be specified for the analysis. |
| Defaults | Reset back to the default settings. Clicking the right mouse on this button produces a shortcut menu where you can choose to set the options using the currently stored defaults or the Genstat default settings. |
| Save | Opens a dialog where you can save results from the analysis. |
| Predict | Lets you form predictions based on the current model. |
| Further output | Opens a dialog for specifying further output from the analysis and displaying residual and means plots. |
Action Icons
| Pin | Controls whether to keep the dialog open when you click Run. When the pin is down |
|
| Restore | Restore names into edit fields and default settings. | |
| Clear | Clear all fields and list boxes. | |
| Help | Open the Help topic for this dialog. |
See also
- Options for specifying output options
- Further Output for obtaining additional output
after fitting a model - Save for saving the results from a REML analysis
- REML directive for command mode use of REML, with additional options to
control the algorithm and for more sophisticated analyses. - Reml Predictions menu for forming predictions.