Use this to select different options to be used in a Response Surface for the spline model.
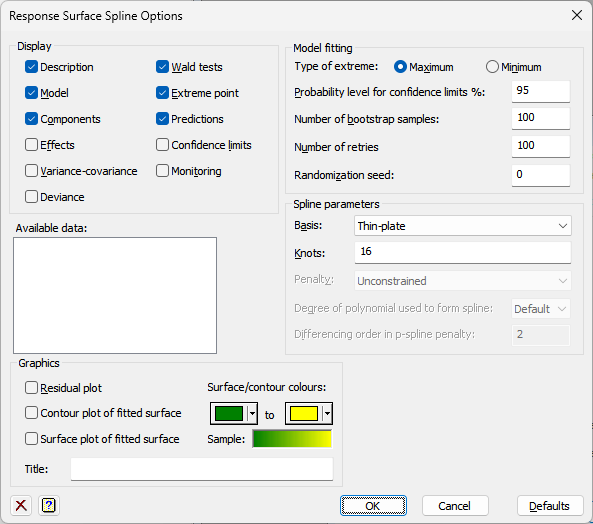
Display
Specifies which items of output are to be displayed in the Output window.
| Description | A description of the model, including spline information |
| Model | A description of the REML model |
| Components | Estimates of variance components |
| Effects | Estimates of the fixed and random effects |
| Variance-covariance | Variance-covariance matrix of the estimated components |
| Deviance | Deviance of the fitted model (-2 × log-likelihood) |
| Wald tests | Wald tests for fixed terms |
| Extreme point | The y and x values at the extreme point |
| Predictions | The predictions from the fitted surface at the specified X-1 and X-2 prediction levels |
| Confidence limits | Confidence intervals for y and x values at the extreme point. The confidence limit can specified as a percentage using the Probability level for confidence limits (%) field |
| Monitoring | Monitoring information from the REML estimation and the bootstrapping |
Model fitting
| Type of extreme | This specifies whether the Maximum or Minimum of the fitted surface will be used for the extreme point |
| Probability level for confidence limits (%) | This gives the probability (as a percentage) that the confidence interval covers the true value. This should be a value between 0 and 100. For probabilities close to 100, the interval will not be well estimated if the number of bootstraps is insufficiently large |
| Number of bootstrap samples | This gives the number of times the resampling will be performed to estimate the standard errors or confidence limits. Increasing this will slow the analysis down, but give more accurate results |
| Number of retries | When the REML analysis fails for a sample, extra samples will be taken, until the number of failures exceeds this value |
| Randomization seed | This gives a seed to initialize the random number generation used for bootstrapping. Using zero continues the current random number sequence or, if no random numbers have been used previously, it initializes the seed from the computer’s clock. Specifying an nonzero value gives a repeatable analysis |
Available data
This lists data structures appropriate to the Knots field. Double-click a name to copy it to the Knots field or type in the names.
Spline parameters
Basis:
This specifies the basis functions used to calculate the spline terms.
| Thin-plate | A thin-plate spline created using the THINPLATE procedure |
| P-spline | A p-spline created using the TENSORSPLINE procedure |
| Penalized spline | A penalized spline created using the TENSORSPLINE procedure |
Note p-splines and penalized splines are collectively known as tensor splines.
Knots:
This defines the positions of the knots for the splines, by either:
| A scalar or number | This gives the total number of knots. They are divided automatically between the two x-variates |
| A variate of length 2 or 2 scalars/numbers | This gives the total number of knots in the X1 and X2 directions. Separate the numbers or scalars with a space or comma |
| A pointer to 2 variates or two variates | This gives the positions of the knots in the X1 and X2 directions. Separate the variates with a space or comma |
Note the values entered will be modified to be in the format required for the VSURFACE procedure. e.g. !(5,5), !(Scalar1,Scalar2) or !p(Variate1,Variate2).
Penalty (tensor spline only):
The penalty controls the interaction between the one-dimensional spline bases in the tensor splines.
| Unconstrained | Allows a separate smoothing parameter for each term. In this case, the basis pointer has 2d+3 matrices, one for each term |
| Semi-constrained | The same smoothing parameter is imposed across the interaction of polynomials in the first dimension with random terms in the second, and for the interaction of random terms in the first dimension with polynomials in the second dimension |
| Isotropic | Use a single common penalty with the terms combined into a single matrix |
Degree of polynomial used to form spline (tensor spline only):
The drop-down list specifies the degree of polynomial used to form the underlying tensor spline basis functions. The Default is 3 for p-spline models, and 1 for penalized spline models.
Differencing order (p-spline only):
In a p-spline model, the underlying fixed polynomial in each dimension has degree d equal to the differencing order minus 1.
Graphics
This controls what graphical plots are displayed from the analysis:
| Residual plots | Plots residuals from the analysis using the VPLOT procedure |
| Surface plot of fitted surface | Uses the DSURFACE directive to produce a surface plot of the fitted model |
| Contour plot of fitted surface | Uses the DCONTOUR directive to produce a contour plot of the fitted model |
| Surface/contours colours | This allows you to select the colours used for the low to high values in the surface and contour plots. Click the colour buttons to change the colours for the low and high values. The Sample field shows the colour range that will be used in the graph |
See also
- Response Surface menu
- Response Surface Spline Store Options
- Response Surface Quadratic Options
- Response Surface Quadratic Store Options
- VSURFACE procedure in command mode
- THINPLATE procedure in command mode
- TENSORSPLINE procedure in command mode