Use this to to set the options for a spatial plot of microarray data.
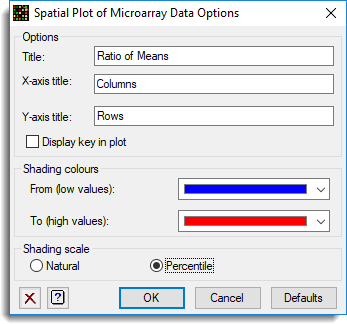
Title
The main title at the top of the graph.
X axis title
The title on the XAXIS of the graph.
Y axis title
The title on the YAXIS of the graph.
Display key in plot
Display a key indicating the shades used for the range of values.
Shading colours
These two colours are used for shading the spatial plot. The colour of any point will be a linear blend of the two colours. You select the extreme colours to be used and all other colours will be made as a mixture of these two. For example, with the default low values as blue and the high as red, the intermediate colours will be in purple.
| From (low values) | A dropdown list of colours. Select the colour to be used to shade the lowest values in the shade plot. |
| To (high values) | A dropdown list of colours. Select the colour to be used to shade the highest values in the shade plot. |
Shading scale
The plot shades the cells of the plot in a progression of 512 shades between the two colours chosen. The range of values assigned to each class is controlled by this option:
| Natural | The shade classes are equal widths on the natural scaling of the data. |
| Percentile | The shade classes contain equal numbers of points, i.e. spaced equally on the percentiles of the data. |
Action buttons
| OK | Save the options settings and close the dialog. |
| Cancel | Close the dialog without making any changes. |
| Defaults | Reset the options to their default settings. |
Action Icons
| Clear | Clear all fields and list boxes. | |
| Help | Open the Help topic for this dialog. |
See also
- Spatial plot menu
- MASHADE procedure