Select menu: Spread | Calculate | Summary Stats
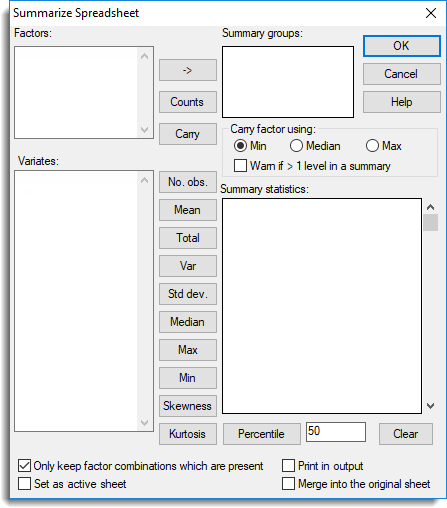
The summarize spreadsheet dialog allows summary statistics to be generated for a selected set of columns. The summaries can also be calculated within groups by supplying a list of factors to cross-tabulate with. The calculated summary statistics are displayed as variates columns within a spreadsheet along with any factor combinations that may have been specified. The new factors and variates are named by prefixing the original column names. For example, names are prefixed with f_ factors and c_, m_, t_, v_, s_, d_, n_ and m_ for number of observations, means, totals, variances, standard deviations, medians, minima and maxima respectively.
- After you have imported your data, from the menu select
Spread | Calculate | Summary Stats. - Fill in the fields as required then click OK.
A factor that is not used in defining the groups can be included in the summary spreadsheet using the Carry button.
If there are no grouping factors specified the summary statistics for each column are calculated using the DESCRIBE procedure. Similarly, if the summary statistics are calculated within groups the TABULATE directive is used.
Factors
A list of the factors in the spreadsheet which can be used to define summary groups. Double-clicking on a factor name will place this in the Summary groups field. You can transfer multiple selections from Factors by holding the Ctrl key on your keyboard while selecting items, then click ![]() to move them all across in one action.
to move them all across in one action.
Summary groups
Specifies a set of factors that define the groups that the summaries will be calculated over. Factor names can be added to this list by double-clicking on the name in the Summary groups field, or the names can be entered in directly. Multiple selections can be transferred from the Summary groups field by clicking the ![]() button. The groups used for the summary statistics are defined as the factorial combination all the factors within this list. The resulting spreadsheet will contain a row for each factor combination, whether it contains any observations or not. If a combination is not present in the data then the summary statistics will produce a missing value (except for counts which will be zero). The defining factors in the summary spreadsheet are named by prefixing the original name with the characters ‘f_’.
button. The groups used for the summary statistics are defined as the factorial combination all the factors within this list. The resulting spreadsheet will contain a row for each factor combination, whether it contains any observations or not. If a combination is not present in the data then the summary statistics will produce a missing value (except for counts which will be zero). The defining factors in the summary spreadsheet are named by prefixing the original name with the characters ‘f_’.
If no factors are specified, then the summary statistics will be calculated using all values in each variate column.
Carry
If the summary statistics are being summarized over groups this option can be used to maintain a factor in the spreadsheet using one of the Carry factor using options.
| Min | Minimum factor level in the group. |
| Median | Median factor level in the group. |
| Max | Maximum factor level in the group. |
If the factor levels are unique within each group, then the above options are ignored.
If the Warn if >1 level in a summary is selected, a warning will be generated if a group contains more than one level of the factor.
Variates
A list of available variate columns in the spreadsheet which can have summary statistics calculated. A summary statistic for a given column is created by selecting one or more of the columns, and then clicking the appropriate statistic button.
Statistics
| Counts | The number of units in the group (no variate is required for this summary). | Prefix r_ |
| No Obs | The number of non missing values. | Prefix c_ |
| Mean | The mean or average value. | Prefix m_ |
| Total | The total or sum of the values. | Prefix t_ |
| Var | The variance of the values. | Prefix v_ |
| Std Dev | The standard deviation of the values. | Prefix s_ |
| Median | The median of the values. | Prefix d_ |
| Max | The maximum or largest value. | Prefix x_ |
| Min | The minimum or smallest value. | Prefix n_ |
| Skewness | This calculates the skewness of each group. Skewness is a measure of the asymmetry of a distribution. A symmetrical distribution has a skewness of zero. A distribution with a longer lower tail has a negative skewness, and one with a longer positive tail has a positive skewness. | Prefix w_ |
| Kurtosis | This calculates the kurtosis of each group. Kurtosis is a sample statistic that measures the extent to which a continuous distribution is “peaked”: that is, it lets you assess whether the distribution curve has most of its area close to the centre or whether it has long tails. The expected value for a Normal distribution is zero. | Prefix k_ |
| Percentile | The Nth percentile of the values, where N (in the range [0,100]) is supplied in the space provided. Note that if no groups have been specified in the Summary groups field then only the percentiles 25%, 50% and 75% (the lower quartile, median and upper quartile respectively) can be calculated. | Prefix q_ |
Summary statistics
Specifies the summary statistics that are to be calculated. Different summary statistics can be calculated simultaneously for each column and the column order in the resulting spreadsheet will be that specified by the order in this list.
Only keep factor combinations which are present
When selected, any combination of the grouping factors specified in the Summary groups field that has no observations in it will be removed from the summary spreadsheet.
Print in output
Prints the selected summary statistics in the Output window.
Set as active sheet
Sets the newly created spreadsheet to be the active spreadsheet.
Merge into the original sheet
The results for the summary statistics are merged back into the spreadsheet that is being summarized. A new column is created for each statistic where the values are inserted using the matching factor combinations as specified in the Factors list.
Clear
Clear the Summary groups and Summary statistics fields.
See also
- Summary tables menu
- Tally table menu
- Merge spreadsheet
- Reshape Data menu
- VSUMMARYprocedure can be used in the command language to create the same types of summaries