Summary statistics, such as means, standard deviations, etc, can be generated for a selected set of columns. The summaries can also be calculated within groups by supplying a list of factors to cross-tabulate with. This can be used for aggregating summaries, or for expanding a set of factors to give a row for every factorial combination.
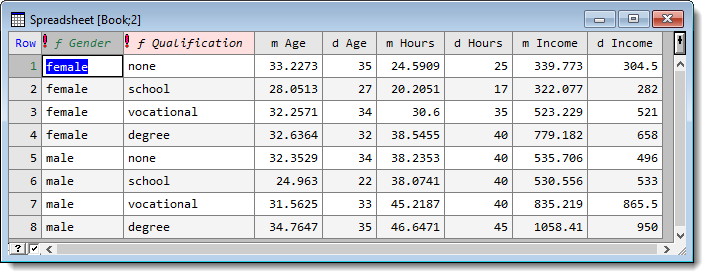
The calculated summary statistics are displayed as variate columns within a spreadsheet along with any factor combinations that you have specified. The new factors and variates are named by prefixing a character to the original column names. For example, names are prefixed with f_ for factors, m_ for mean, d_ for median, etc.
A factor that is not used in defining the groups can be included in the summary spreadsheet using the Carry button. If there are no grouping factors specified the summary statistics for each column are calculated using the DESCRIBE procedure. Similarly, if the summary statistics are calculated within groups the TABULATE directive is used.
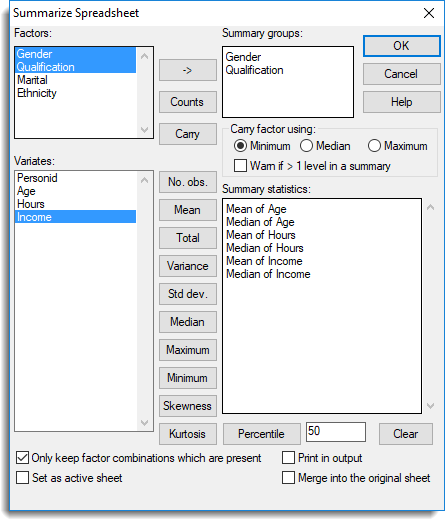
- From the menu select Spread | Calculate | Summary Stats.
- Move factors into the Summary groups field by double-clicking them.
- You can select multiple factors by holding down Ctrl while clicking with the mouse, then click
 to move them all across in one action.
 - If no factors are specified the summary statistics will be calculated using all values in each variate column.
- You can select multiple factors by holding down Ctrl while clicking with the mouse, then click
- Select the variates you want to calculate summary statistics for by holding Ctrl while clicking with the mouse.
- Click the required statistic button to apply it to the selected variates. This moves the variates to the Summary statistics field.You can calculate different summary statistics simultaneously by repeating steps 3 to 4 multiple times.
- Click OK at the top right of the dialog to produce the spreadsheet.
| Factors | Lists the factors in the spreadsheet which can be used to define summary groups. |
| Summary groups |
Specifies a set of factors that define the groups that the summaries will be calculated over. The groups used for the summary statistics are defined as the factorial combination all the factors within this list. The resulting spreadsheet will contain a row for each factor combination, whether it contains any observations or not. If a combination is not present in the data then the summary statistics will produce a missing value (except for Counts, which will be zero). The defining factors in the summary spreadsheet are named by prefixing the original name with the characters ‘f_’. If no factors are specified, then the summary statistics will be calculated using all values in each variate column. |
| Carry |
If the summary statistics are being summarized over groups this option can be used to maintain a factor in the spreadsheet using one of the Carry factor using options. If the factor levels are unique within each group these options are ignored.
|
| Warn if > level in a summary | When selected a warning will be generated if a group contains more than one level of the factor. |
| Variates | Lists the available variate columns in the spreadsheet which can have summary statistics calculated. A summary statistic for a given column is created by selecting one or more of the columns then clicking the appropriate statistic button. |
| Statistics buttons |
|
| Summary statistics | Specifies the summary statistics that are to be calculated. Different summary statistics can be calculated simultaneously for each column. The column order in the resulting spreadsheet will be the same as the order in this list. |
| Only keep factor combinations which are present | Any combination of the grouping factors specified in the Summary groups list that has no observations in it will be removed from the summary spreadsheet. |
| Print in output | Prints the selected summary statistics in the Output window. |
| Set as active sheet | Sets the resulting spreadsheet as the Active spreadsheet. |
| Merge into the original sheet |
The results for the summary statistics are merged back into the spreadsheet that is being summarized. A new column is created for each statistic where the values are inserted using the matching factor combinations as specified in the Factors list. |
| Clear | Clear the Summary groups and Summary statistics fields. |