Select menu: Stats | Statistical Tests | One- and two-sample t-tests
Performs a one- or two-sample t-test. The menu carries out validity checks. If any sample has fewer than 6 values Genstat warns you that the sample size is too small and the test may not be valid. For a two-sample test, Genstat carries out an F-test for equality of variance and prints a warning if there is evidence of unequal variances. For a two-sample t-test you can also choose to calculate the probability using a random permutation test.
- After you have imported your data, from the menu select
Stats | Statistical Tests | One- and two-sample t-tests. - Fill in the fields as required then click Run.
You can supply weights to replicate observations by clicking Options. After running, you can save the results by clicking Save.
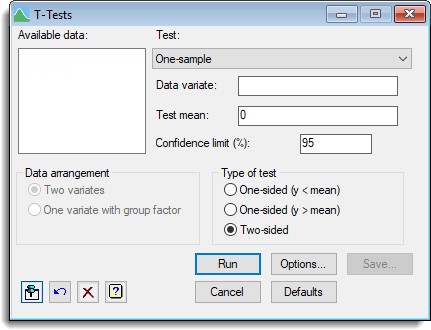
Available data
Lists the variates and factors that can be used to supply the data sets and/or groups. The contents may change as you move from one input field to another, so that appropriate types of data structure are listed. Double-click on a name to copy it into the input field, or type the name in directly.
Test
Specifies the test to be carried out: One-sample, Two-sample, or Paired samples.
One-sample test
| Data variate | Specifies the name of the variate containing the data. |
| Test mean | Specifies mean for the null hypothesis of a one-sample test. |
Two-sample test
For a two-sample test you can supply the data in one of two ways using the Data arrangement options. You can specify the data as a pair of variates:
| Data variate 1 | Specifies the name of the variate containing the first data sample. |
| Data variate 2 | Specifies the name of the variate containing the second data sample. |
or as a single variate with a factor defining the groups:
| Data variate | Specifies the name of the variate containing the data sample. |
| One variate with group factor | Specifies the name of a factor defining the group membership. |
Paired samples
For a paired sample t-test you should supply the data as two data variates where the paired observations are stored in the same unit (or row) position within both variates.
| Data variate 1 | Specifies the name of the variate containing the first data sample. |
| Data variate 2 | Specifies the name of the variate containing the second data sample. |
Confidence limit
Enables you to control the limit for the calculation of a confidence interval. The limit is expressed as a percentage and must be in the range 0-100.
Equivalence limit(s)
For the Equivalence, Non-inferiority and Non-superiority type of tests, this gives the limits for the difference between the means. The limits for the type of tests are.
| Equivalence | An upper and lower limit for which the two means are judged to be equivalent when the difference between them falls within this range. The lower limit must be negative and the upper limit positive. |
| Non-inferiority | A lower limit that the second mean is judged to be not-inferior when the difference from the first mean is above this limit. The limit must be negative, so if a positive value is entered, its sign is changed to make it a negative value. |
| Non-superiority | An upper limit that the second mean is judged to be not-superior when the difference from the first mean is below this limit. The limit must be positive, so if a negative value is entered, its sign is changed to make it a positive value. |
Type of test
Enables you to choose the type of t-test to perform.
| One sided (y < mean) | The null hypothesis is that the difference between the means is zero versus the alternative hypothesis that difference is positive. |
| One sided (y > mean) | The null hypothesis is that the difference between the means is zero versus the alternative hypothesis that difference is negative. |
| Two-sided | The null hypothesis is that there is no difference between the means. |
| Equivalence | The null hypothesis is that the difference between the mean of the first sample and the mean of the second sample lies outside two limits specified in the Equivalence limits fields. |
| Non-inferiority | The null hypothesis is that the mean of the first sample minus the mean of the second sample is less than the negative value specified, in the Equivalence limit field. |
| Non-superiority | The null hypothesis is that the mean of the first sample minus the mean of the second sample is greater than the positive value specified, in the Equivalence limit field. |
See also
- T-Test Options to control printed output and to perform a random permutation test.
- T-Test Save Options to store the results
- Bootstrap Resampling menu for bootstrapping t-tests
- TTEST procedure