The following picture illustrates many features of the Genstat Windows Interface. Click on any Menu or Window to get further help on this item. Use the scroll bars to see more of the picture. The examples in the guide to using a spreadsheet illustrates features of the Genstat spreadsheet.
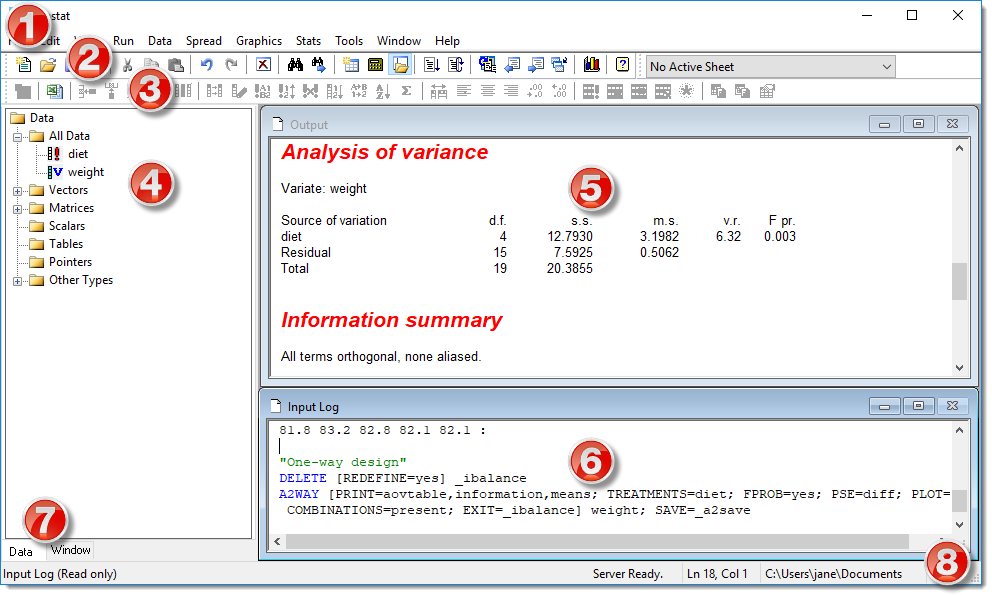
| 1. Menu bar | The menu bar is located at the top of the main Genstat window. Commands on the menu bar can be accessed using the mouse, or from the keyboard by pressing the Alt key followed by the underlined letter. |
| 2. Standard toolbar | The Standard toolbar provides a quick shortcut to many frequently used functions. When a toolbar button is clicked its function is indicated on the status bar (8). |
| 3. Spreadsheet toolbar | The Spreadsheet toolbar provides a quick shortcut to many frequently used functions. When a toolbar button is clicked its function is indicated on the status bar (8). |
| 4. Data view | A display containing a summary of all the data structures currently loaded in Genstat’s memory e.g. factors, variables, scalars, etc. |
| 5. Output window | All Genstat output is directed to this window. It is updated asynchronously with results as they become available from the Genstat Server. By default, the output is displayed in RTF and is read-only. However, you can change to standard text by selecting View | Output | Plain Text from the main menu bar (1). |
| 6. Input log | A window which contains a record of all the commands generated by menu selections and sent to Genstat. This window cannot be closed, but you can minimize it to keep it from being displayed. |
| 7. Data and Window tabs | Selecting the Data tab will display all the data currently within Genstat. Selecting the Window tab will display of the windows and menus you currently have open. |
| 8. Status bar | The status bar is located at the bottom of the main Genstat window. It displays various items of information about the current state of Genstat. It also indicates toolbar functions when buttons are clicked. |
See also