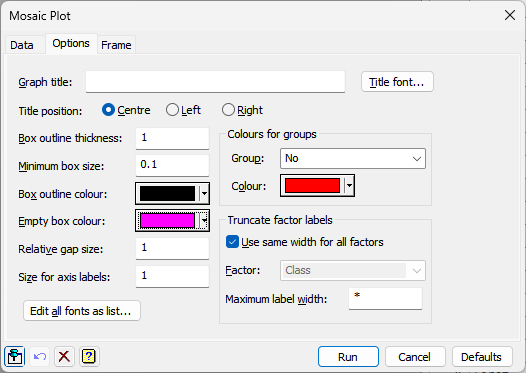
Use this to set attributes to control the appearance of a Mosaic Plot.
Graph title
Lets you specify a title for the plot. The title appears at the top of the graph.
Title font
This opens the Edit Font menu that lets you control the font for the title.
Title position
You can position the title by selecting the Centre, Left or Right option.
Box outline thickness
The outlines of the boxes will drawn with a line of this thickness. A value of one gives the default line thickness, zero will hide the outlines, and two will double the line thickness. This value must be between 0 and 10.
Minimum box size
To avoid boxes with zero or low counts from being visually lost in the plot, a minimum box size is set. This value is an approximate proportion of the overall plot size so a value of 0.01 is about 1%. (This is only approximate as the exact value depends on the number and size of gaps in each direction.) Both the box dimensions, height and width, will be restricted to be at least this size. This value must be between 0 and 0.1.
Box outline colour
The outlines of the boxes in the plot will be drawn in this colour. To change this colour, click the button and select the new colour from the colour picker dialog.
Empty outline colour
A cell with a zero count (i.e. no observations) will have the outline of its box drawn in this colour. To change this colour, click the button and select the new colour from the colour picker dialog.
Relative gap size
The boxes in the plot have a small gap between them to visually separate them. This is larger for changes in the higher order factors (i.e. those earlier in the Column factors and Row factors lists). The relative size of these gaps can be modified by setting a multiplier for the standard gap sizes. A value of one gives the default gap sizes. Other values increase/decrease the gap sizes by that multiplier. For example, a value of zero will leave no gaps, while two will double the size of the gaps. The value must be between 0 and 10.
Size for axis labels
This sets the size of the characters in the axis labels. A value of one gives the default character size. Other values increase/decrease the size by that multiplier. A value of zero will hide the labels, while two will double the size of the labels. The value must be between 0 and 10.
Colours for groups
The boxes are filled with a colour based on the level of the final row factor in that cell. There is a colour for each level/group in the factor. To change the colour for a group, select that group from the drop-down Groups list. The current colour for that group will be displayed in the Colour button. To change the colour, click the button and select the new colour from the colour picker dialog. You will get a warning if two groups are assigned the same colour. However, you can proceed anyway, if this is what you want. Note: empty boxes are not coloured.
Truncate factor labels
When there are many factors in the plot, the axis labels may overlap. You can reduce this problem by truncating/abbreviating the labels. For example, labels Male and Female could be truncated to M and F respectively, or Yes and No to Y and N respectively. These fields allow you to truncate the labels of each factor, by specifying a Maximum label width. Any characters beyond the Maximum label width will be truncated, e.g. a value of 3 would abbreviate the labels Low, Medium and High to Low, Med, Hig. If Use same width for all factors is ticked, this Maximum label width will apply to all factors, and the Factor list will be disabled. Otherwise you can select a factor using the Factor drop-down list, and enter a value for Maximum label width that will apply only to the selected factor. Selecting the different factors and assigning their values will allow every factor to have its own amount of truncation. If Maximum label width is set to * or left empty, no truncation will occur for that factor.
Action buttons
| Run | Produce the graph. |
| Cancel | Close the menu without further changes. |
| Defaults | Reset the options to their default settings. |
Action Icons
| Pin | Controls whether to keep the dialog open when you click Run. When the pin is down |
|
| Restore | Restore names into edit fields and default settings. | |
| Clear | Clear all fields and list boxes. | |
| Help | Open the Help topic for this dialog. |
See also
- Mosaic Plot – Data tab for this menu
- Frame options
- Edit font dialog
- DMOSAIC procedure