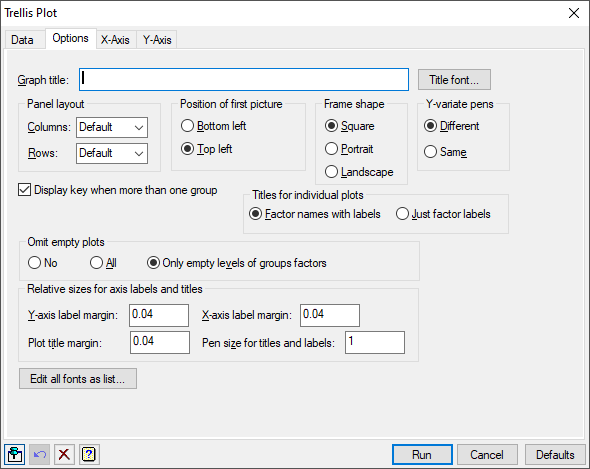
Use this to set attributes to control the appearance of a trellis plot.

Graph title
Lets you enter a title for the graph. The title appears centred at the top of the graph.
Title font
This opens the Edit Font menu that lets you control the font for the title.
Panel layout
Specifies the number of rows and columns of plots to appear within one window. You either select a number from the available list or enter the numbers directly.
Position of first picture
Controls how the plots are to be drawn in a window. Select Bottom left to start drawing the plots from the bottom left of the window or select Top left if you want the plots to start from the top left of the window.
Frame shape
These options control the size of the frame for the trellis plot.
| Square | The frame is square. |
| Portrait | The frame fills a portrait oriented page. |
| Landscape | The frame fills a landscape oriented page. |
Y-variate pens
This option controls the pens used in a trellis plot with multiple series using groups within frames. The pens control the symbols and colours used for the groups of each series.
| Different | Each series uses different pens for each group, e.g. for two series with three groups the pens will be 1,2,3, 4,5,6. |
| Same | The same pen for a group will be used by all the series, Note the groups will be still plotted with different pens, e.g. for two series with three groups the pens will be 1,2,3, 1,2,3. |
Display key when more than one group
Controls whether to display a key when each window of the trellis plot contains more than one group, for example, when there are several y-variates or a factor has been supplied for the groups within frames.
Number of groups in histogram
For a trellis diagram of histograms you can specify the number of groups by entering a value in the space provided. If this is left blank then Genstat will automatically generate the number of groups.
Titles for individual plots
This option controls the titles for the individual plots with a trellis plot.
| Factor names with labels | The names and the labels of the factors will be used. For example with Gender and Voted (No, Yes) the labels would be ‘Gender Female, Voted No’, ‘Gender Female, Voted Yes’, etc. |
| Just factor labels | Just the labels of the factors will be used. In the above example, the labels would be ‘Female, No’, ‘Female, Yes’, ‘Male, No’ and ‘Male, Yes’. |
Omit empty plots
This option controls if plots containing no data points are plotted.
| No | All the empty plots will be included in the trellis plot. |
| Yes | All the empty plots will be excluded from the trellis plot. |
| Only empty levels of groups factors | Only plots associated with a factor group which has no observations will excluded from the trellis plot. This is only different from Yes if there are multiple factors in Groups for frames. For example, if the combination of factors A and B had no observations in group A=1 B=1 but some observations in A=1, B=2 and A=2, B=1, then this group would still be plotted when this item was selected, as groups A=1 and B=1 both have observations elsewhere in the trellis plot. |
Relative sizes for axis titles and labels
These options control the sizes and space allowed for the plot and axis titles.
| Y-axis label margin | controls the space on the left of the plots for the Y-axis label. |
| X-axis label margin | controls the space below the plots for the X-axis label. |
| Plot title margin | controls the space above the plots for the individual plot labels. |
| Pen size for titles and labels | controls the size of the font used for the titles and axis labels. |
Edit all fonts as a list
Clicking this opens the Edit All Fonts as a List dialog which allows all the fonts in the graph to be set in one place.
Action buttons
| Run | Produce the graph. |
| Cancel | Close the dialog without further changes. |
| Defaults | Reset the options to their default settings. |
Action Icons
| Pin | Controls whether to keep the dialog open when you click Run. When the pin is down |
|
| Restore | Restore names into edit fields and default settings. | |
| Clear | Clear all fields and list boxes. | |
| Help | Open the Help topic for this dialog. |
See also
- Trellis plot data tab menu
- Edit font dialog
- Edit All Fonts as a List
- TRELLIS procedure