Use this to to control additional options and settings for the 2-D Plots of microarray data menu.
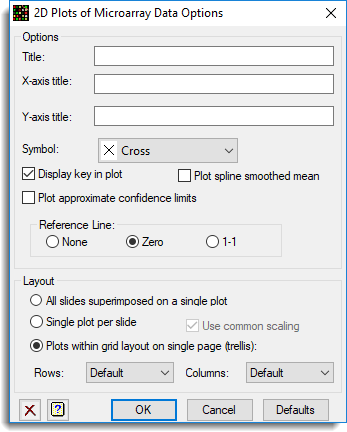
Title
The main title to appear at the top of the graph.
X axis title
The title for the X axis of the graph.
Y axis title
The title for the Y axis of the graph.
Symbol
The symbols to be used for plotting the points in the graph.
Display key in plot
Display a key indicating the slides for a superimposed graph, or the Groups within plots factor levels. This item is ignored for the Trellis plot option.
Plot spline smoothed mean
Add the curve fitted by a cubic smoothing spline to the plot of Y on X. Using the command language this could be calculated as follows:
CALC SMean = SSPLINE(Y;X;12)
Plot approximate confidence limits
Plot smoothed confidence limits that will approximately cover 95% of the values if the data were normally distributed about the smoothed mean curve. This could be calculated using the command language as follows:
CALC SMean = SSPLINE(Y;X;12)
CALC SRes = (Y – SMean)**2
CALC SRes = SQRT(SSPLINE(SRes;X;12))
CALC Lower,Upper = SMean + (-2,2)*SRes
Reference line
There are three options on whether to add a reference line to the plots:
| None | Do not add a reference line to the plots. |
| Zero | Add the zero reference line Y = 0 to the plots. |
| 1-1 | Add the 1-1 reference line Y = X to the plots. |
Layout
There are three options on how the individual XY plots for each slides are laid out on the page:
| All slides superimposed on a single plot | Produces a single plot containing points from all slides, with the different slides points displayed in differing colours (which recycle after 50 slides). |
| Single plot per slide | Each slide will be plotted on its own page |
| Plots within grid layout on single page (trellis) | The plots of each slide will be separate panels on a single page (although new pages will be produced when the number of panels exceeds the Rows and Columns settings. |
Use common scaling
When plotting graphs on separate pages with the Single plot per slide option, use the same X and Y range on all axes.
Rows and Columns
When plotting graphs on single page with the Plots within grid layout on single page (trellis) option, use a grid containing the specified number of rows and columns to hold the graphs.
Action buttons
| OK | Store the settings and close the dialog. |
| Cancel | Close the dialog without making any changes. |
| Defaults | Reset the options to the default settings. |
Action Icons
| Clear | Clear all fields and list boxes. | |
| Help | Open the Help topic for this dialog. |
See also
- 2D Plots of Microarray data
- Microarray menus
- Histograms
- Spatial Plot
- Volcano Plot
- TRELLIS procedure for trellis plots using command language