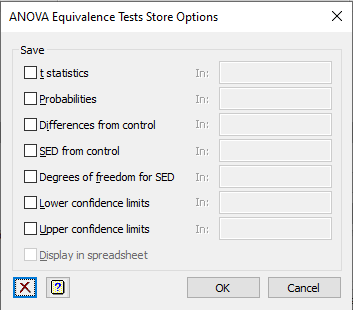
Use this to save results from the ANOVA Equivalence Test in Genstat data structures.

Save
After selecting the appropriate boxes, type the identifiers of the data structures into the corresponding In: fields.
| t statistics | Table | t statistics of the comparison with the control for each group in the treatment term |
| Probabilities | Table | Probability of the selected test for each group in the treatment term |
| Differences from control | Table | Differences from control for each group in the treatment term |
| SED from control | Table | Standard errors of differences from control for each group in the treatment term |
| Degrees of freedom for SED | Table | The degrees of freedom of the standard errors of differences from control for each group in the treatment term |
| Lower confidence limits | Table | Lower confidence limits for differences from control – these will be missing for a non-inferiority test |
| Upper confidence limits | Table | Upper confidence limits for differences from control – these will be missing for a non-superiority test |
Note the control group will have a missing value in each of the result tables.
Display in spreadsheet
Select this to display the results in a new spreadsheet window. The tables will be displayed as separate pages within a common book.
See also
- ANOVA Equivalence Test dialog
- Further Output for additional output subsequent to ANOVA
- Analysis of variance menu
- One and two-way analysis of variance menu
- Analysis of Variance by ANOVA, Regression or REML menu
- ANOVA Options for choosing which results to display
- Residual Plots and Means Plots for graphical output
- Multiple Comparisons dialog for specifying multiple comparisons
- Save ANOVA results in a spreadsheet
- TEQUIVALENCE procedure
- TTEST procedure