Use this to select the output to be generated initially by ANOVA – the same information can also be printed after the analysis, using the Further Output dialog.
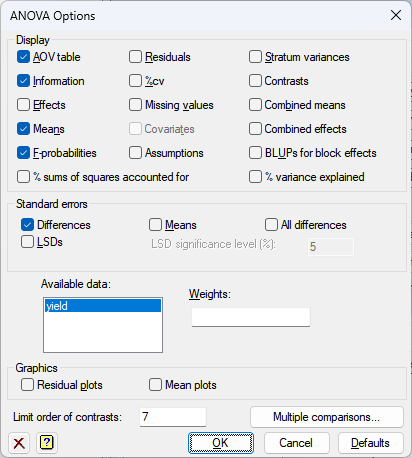
Display
Specifies which items of output are to be produced.
| AOV table | Analysis of variance table |
| Information | Details of large residuals, non-orthogonality and any aliasing in the model |
| Effects | Tables of estimated treatment parameters |
| Means | Tables of means for treatment terms |
| F-probabilities | F-probabilities for the analysis of variance table |
|
% sums of squares accounted for
|
This uses the A%VARIANCE procedure to calculate the percentage sums of squares accounted for by treatments in the strata |
| Residuals | Tables of estimated residuals |
| %cv | Coefficients of variation and standard errors of individual units |
| Missing values | Estimates of missing values |
| Covariates | Estimates of covariate regression coefficients |
| Screening tests | Screening tests for treatment terms (unbalanced treatment structure only) |
| Assumptions | Displays any warnings produced by homogeneity, normality and stability tests (not available for unbalanced treatment structure). See ACHECK procedure for details of the tests that are performed. |
| Stratum variances | Estimated variances of the units in each stratum |
| Contrasts | Estimated contrasts of treatment effects |
| Combined means | Means for treatment terms combining information from all the strata in which each term is estimated |
| Combined effects | Estimated effects of treatment terms combining information from all the strata in which each term is estimated |
| BLUPs for block effects | The best linear unbiased predictors (BLUPs) for block terms. These differ from the ordinary ANOVA residuals in that they are predictors rather than estimates of the block effects. The standard errors printed for these are controlled by the Differences, Means and All differences options in the Standard errors section. This uses the ABLUPS procedure. |
| % variance explained | This uses the A%VARIANCE procedure to calculate the percentage variance explained by treatments in the strata |
Standard errors
When printing tables of means you can specify the form in which standard errors will be displayed: as standard errors of the means, standard errors of differences of means (SEDs), or least-significant differences (LSDs). If required, you can print more than one type of standard error. The significance level for LSDs can be specified as a percentage (default 5) in the accompanying field. Note that LSDs cannot be formed for tables combining information over several strata. For an unbalanced treatment structure you can also display the approximate effective standard errors. The standard errors printed for the BLUPs for block effects can be controlled by the settings for differences, means and all differences
Available data (balanced ANOVA only)
This lists data structures appropriate to the Weights field. You can double-click a name to copy it to the Weights field.
Weights (General and unbalanced ANOVA only)
This specifies variate giving a set of weights for the units for a weighted analysis of variance. You might want to do this if, for example, different parts of the experiment have different variability; each weight would then be proportional to the reciprocal of the expected variance for the corresponding unit. However unless the weights are fairly systematic, for example to give proportional weighted replication, the design is unlikely to be balanced.
Missing value iterations (balanced ANOVA only)
This option sets a limit on the number of iterations for estimating missing values. This must be a positive integer. It is unlikely that you will need to increase this from the default of 20 unless there are a large number of missing values in your data.
Graphics
Lets you generate default plots when you produce an Analysis of Variance. Residual plots will produce diagnostic plots of the residuals. Mean plot will produce a graphical display illustrating main effect and interactions for the first two treatment factors. (A simpler plot will be output following one-way analysis of variance.)
Limit order of contrasts
Specify a limit on the order of contrasts to be fitted. For a term involving a single factor, the orders of the contrasts run from one upwards, with the deviations term (if any) numbered highest. In interactions between contrasts, the order is the sum of the orders of the component parts.
Factor combinations for means (Unbalanced design only)
For the unbalanced design, the tables of means are calculated using the PREDICT directive. The first step (A) of the calculation forms the full table of predictions, classified by every factor in the model. The second step (B) averages the full table over the factors that do not occur in the table of means. This option specifies which cells of the full table are to be formed in Step A. The default setting, Estimable, fills in all the cells other than those that involve parameters that cannot be estimated, for example because of aliasing. Alternatively, the setting Present excludes the cells for factor combinations that do not occur in the data.
Standardized method (Unbalanced design only)
For the unbalanced design you can standardize the table of predicted means. The Marginal option forms a table of marginal weights for each factor, containing the proportion of observations with each of its levels; the full table of weights is then formed from the product of the marginal tables. The Equal setting weights all the combinations equally. Finally, the setting Observed weights each factor combination according to its own individual replication in the data.
Multiple comparisons
This opens the Multiple Comparisons dialog which lets you request output of multiple comparison tests and simultaneous confidence intervals. This option is only available if the option Show multiple comparisons on menus has been enabled on the Tools | Options | Menus tab.
See also
- Multiple Comparisons dialog for specifying multiple comparisons.
- ANOVA % Variance and Sums of Squares dialog
- Further Output dialog for additional output subsequent to analysis.
- Permutation Test dialog performing random permutation tests.
- Power for ANOVA menu to estimate the power of the analysis of variance.
- One and two-way analysis of variance menu.
- Parallel ANOVA menu.
- Unbalanced analysis of variance, regression and linear Mixed Models for analysing unbalanced data.
- Linear Mixed Models for analysing unbalanced data.
- ANOVA Equivalence Test dialog.
- ANOVA Equivalence Test Store Options dialog.
- ACHECK procedure for checking assumptions for an analysis of variance.
- ABLUPS procedure to calculate and display the best linear unbiased predictors (BLUPs) for block terms and their standard errors.
- A%VARIANCE procedure.