Selects information to be printed by the analysis and controls certain aspects of the method used.
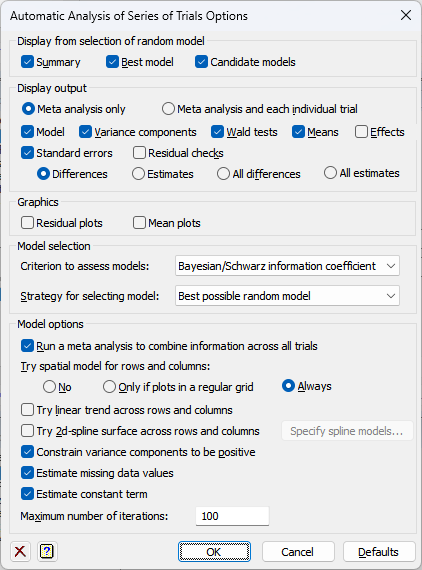
Display from selection of random model
This specifies which items of output are to be produced by the analysis.
| Summary | A summary of the best model found for each trial. |
| Best model | A description of the best model found. |
| Candidate models | A summary of each candidate model tried. |
Display output
This specifies which items of output are to be produced by the analysis using the best fitting model. If Meta analysis only is selected, then these items will be displayed just for the meta analysis over all trials, and if Meta analysis and each individual trial is selected, the output for the best model for each individual trial is produced as well. If Run a meta analysis to combine information across all trials is not selected, then the only output available for selection is for Each individual trial.
| Model | Description of the model fitted by the analysis. |
| Variance components | Estimates of variance parameters. |
| Wald tests | Wald tests for fixed model terms. |
| Means | Predicted means. |
| Effects | Estimates of effects for the fixed effects. |
| Standard errors | Estimates of standard errors for means or effects. |
| Residual checks | Uses the VCHECK procedure to check the residuals for outliers and variance stability |
Standard errors
Tables of means and effects can be accompanied by estimates of standard errors if selected above. You can choose whether Genstat computes standard errors or standard errors of differences (SEDs) for the tables giving all values or just a summary of these.
| Differences | Display the minimum, mean and maximum standard errors of differences between means or effects. |
| Estimates | Display the minimum, mean and maximum standard errors of estimates for means or effects. |
| All differences | Display all the standard errors of differences between pairs of means or effects. |
| All estimates | Display all the standard errors of estimates for means or effects. |
Criterion to assess models
This specifies the criterion to use to select the best random model, if there is more than one possible model with the same number of random terms removed.
| Akaike information coefficient | take the model with the smallest value of the Akaike information coefficient. |
| Bayesian/Schwarz information coefficient | take the model with the smallest value of the Bayesian or equivalently the Schwarz information coefficient. |
Strategy for selecting model
This specifies the strategy for selecting the random model.
| All random terms | Fits the full random model. This is appropriate if the random factors played a key role in the design and its randomization. For example, some factors may have been applied to complete rows or complete columns of a row-and-column-design (as in a strip-block design). |
| All feasible random terms | Tries to fit the full random model. If this is not possible, it tries models removing first one random term, then two and so on, until successful. |
| Best possible random model | Tries all feasible random models and takes the best one. With row-and-column designs this may take a while, and so may be best left for the occasions when you are unsure what to do, or want to check the result from an automatic search. |
| Fast strategy to find best model | follows an automatic strategy that aims to find the best random model for a row-and-column design without having to fit all of them. So, for example, it does not try models that include a column main effect as well as a spatial covariance model along rows. |
Run a meta analysis to combine information across all trials
If this box is checked, then a meta analysis will be used to combine information across all trials, using the model selected for each trial. In this meta analysis, effects in each trial are weighted according to their variances and weighted averages of the trial effects are calculated to give overall estimates. See the VAMETA procedure for more details.
Try spatial model for rows and columns
This specifies whether spatial correlation models are tried with the row and column effects.
| No | Do not fit a spatial model. |
| Only if plots in a regular grid | A spatial model will be fitted, if the plots form a complete grid of rows x columns within each replicate. |
| Always | Always fit a spatial model. |
For a regular grid, when a spatial model is being fitted, the analysis tries models with order 1 auto-regressive structures on the rows and/or the columns of the design, provided there are more than four rows or columns, respectively. For an irregular grid, if there are more than four rows and more four columns, it tries an anisotropic power-distance model using city-block distance. Otherwise, if there is only one dimension with more than four coordinates, it tries an isotropic power-distance model.
Try linear trend across rows and columns
You can set option on to see whether linear row and column trends (i.e. covariates) are needed in the fixed model. If this is selected, you must provide row and column coordinates.
Constrain variance components to be positive
This specifies whether the variance components are constrained to be positive.
Estimate missing data values
This specifies whether predictions are formed from the fitted model for missing values of the y-variate.
Estimate constant term
Specifies whether a constant term is included in the fixed model.
Maximum number of iterations
Specifies the maximum number of iterations that can be used by the REML analysis to converge to a solution.
See also
- Automatic Analysis of Series of Trials menu.
- Further Output for additional output after fitting a model.
- Save for saving the results from the analysis.
- REML Predictions dialog for forming predictions.
- VASERIES procedure for automatically fitting the best models each trial in a series using command mode.
- VAMETA procedure for automatically fitting the best model overall trials in a series using command mode.