Use this to select further output following an automatic analysis of series of trials. The individual trial or the meta analysis of all trials must be selected using the Model for further output dropdown list.
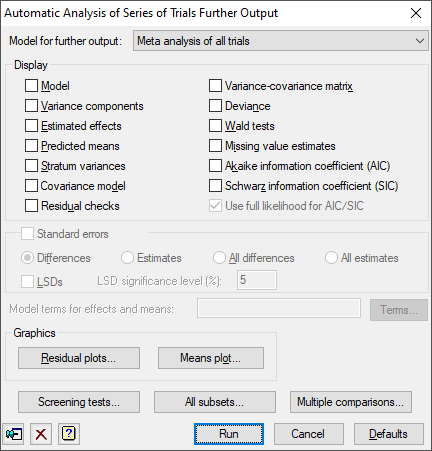
Model for further output
The results are saved for the selected trial or the meta analysis. The meta analysis option will be available only if the Run a meta analysis to combine information across trials option has been chosen in the Options dialog,
Display
This specifies which items of output are to be produced by the analysis.
| Model | Description of the model fitted by the analysis |
| Variance components | Estimates of variance parameters |
| Estimated effects | Estimates of regression coefficients |
| Predicted means | Predicted means |
| Stratum variances | Estimates of approximate stratum variances |
| Covariance model | Estimated covariance models in matrix format |
| Residual checks | Uses the VCHECK procedure to check the residuals for outliers and variance stability |
| Variance-covariance matrix | Variance-covariance matrix for the variance parameters |
| Deviance | The residual deviance |
| Wald tests | Wald Tests for fixed model terms and accompanying F-statistics |
| Missing value estimates | Estimates of missing values |
| Monitoring | Monitoring information at each iteration |
| Akaike information coefficient (AIC) | Akaike information coefficient to assess the random model |
| Schwarz information coefficient (SIC) | Schwarz information coefficient to assess the random model |
| Use full likelihood for AIC/SIC | The information coefficients are calculated using the full log-likelihood from the VKEEP procedure, otherwise the residual log-likelihood is used. See the VAIC procedure for details |
Standard errors
Tables of means and effects are accompanied by estimates of standard errors. You can choose whether Genstat computes standard errors or standard errors of differences (SEDs) for the tables. Approximate least significant differences (LSDs) for the predicted means of the fixed terms specified in the Model terms for effects and means field can be computed by selecting LSDs. These are calculated using the approximate numbers of residual degrees of freedom printed by the analysis in the d.d.f column in the table of tests for fixed tests (produced by selecting the Wald tests display option). The LSDs will only be produced if the Predicted means option has been selected. The degrees of freedom are relevant for assessing the fixed term as a whole, and may vary over the contrasts amongst the means of the term. So the LSDs should be used with caution. If you are interested in a specific comparison, you should set up a 2-level factor to fit this explicitly in the analysis. The significance level for LSDs can be specified as a percentage (default 5) in the accompanying field.
Method for calculating F-statistics
This controls whether Wald tests for fixed effects are accompanied with approximate F statistics and corresponding numbers of residual degrees of freedom. The computations, using the method devised by Kenward & Roger (1997), can be time consuming with large or complicated models. So, the default setting automatic, can be used to allow Genstat to assess the model itself and decide automatically whether to do the computations and which method to use. The other settings allow you to control what to do yourself:
| none | No F statistics are produced |
| algebraic | F statistics are calculated using algebraic derivatives (which may involve large matrix calculations) |
| numerical | F statistics are calculated using numerical derivatives (which require an extra evaluation of the mixed model equations for every variance parameter). |
Model terms for effects and means
This specifies the model terms, as a formula, for which tables of means and/or effects are displayed. For covariates, the associated linear regression parameter can be printed as an effect, but predicted means are not available. Predicted means for other terms are adjusted to the mean of the covariate (but see note below). The formula can include the string ‘Constant’ to include entries for the constant term.
If no formula is specified, means or effects are produced for all the fixed model terms and none of the random terms.
Graphics
The residual plots button can be used to generate plots of residuals. For the linear mixed models and spatial models – regular grid menus an extended residual plot dialog is opened where you can plot residuals in field layout. For the spatial models – regular grid menu the Display variogram button can be used to display the residuals in a variogram.
Screening tests
The Screening tests button can be used to determine the significance of the fixed terms in the model by calculating marginal and conditional tests for these.
All subsets
The All subsets button can be used to fit all subsets of the Fixed model and select the best of these.
Multiple comparisons
This button will open the Multiple Comparisons for REML menu which lets you
request output of multiple comparison tests. This option is only available if the option Show multiple comparisons on menus has been enabled on the Tools | Options | Menus tab.
See also
- Save REML results in a spreadsheet.
- Automatic Analysis of Series of Trials menu.
- Options for specifying output options.
- Save for saving results after fitting a model.
- Residual Plots for generating plots of residuals.
- Means Plots for generating plots of one- or two-way tables of means.
- Multiple Comparisons for REML menu
- All Subsets of the REML Fixed Model dialog
- REML directive for command mode use of REML, with additional options to control the algorithm and for more sophisticated analyses.
- VCOMPONENTS directive for further information about fixed, random, and spline model terms.
- Linear Mixed Models (REML) – Correlated Errors for setting up covariance models.
- REML Predictions menu for forming predictions.
- REML Screening tests dialog
- Explore fixed model dialog for exploring which terms are important in the fixed model.
- VPLOT procedure for plotting residuals.
- VFRESIDUALS procedure to calculate standardized residuals.
- VCHECK procedure to check the residuals.
- VSCREEN procedure to perform screening tests for fixed effects.
- VKEEP procedure to save results from an REML analysis.
- VAIC procedure to calculate information coefficients.