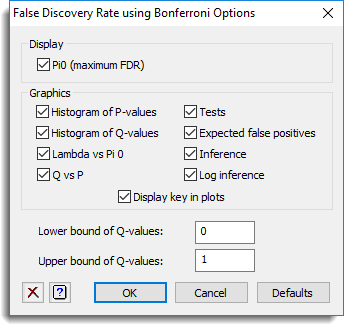
Use this to set the options for the False Discovery Rate using Bonferroni menu.
Display
Specifies which items of output are to be produced.
| Pi 0 | The estimate of π0 |
Graphics
Specifies which graphs are to be produced:
| Histogram of P-values | The histogram of input probabilities |
| Histogram of Q-values | The histogram of q – values – the estimated false discovery rates |
| Lambda vs Pi 0 | The plot of λ against π0 (when only one value of λ is specified the default values (0,0.05…0.9) are used). |
| Tests | The plot of the sorted tests against q-values. |
| Expected false positives | The plot of the number of expected false positives against the sorted tests. |
| Inference | The plot of FDR, FRR and power against p |
| Log inference | The plot of FDR, FRR and power statistics on log scales, with the X-axis restricted to probabilities < 0.5, with a background grid, to enable estimates to be read for specific probability values. |
Display key in plots
Display under the inference plots the key to the curves for FDR, FRR and power.
Lower
Lower bound of q-values to use with plots Q vs P, Tests and Expected false positives.
Upper
Upper bound of q-values to use with plots Q vs P, Tests and Expected false positives.
Action buttons
| OK | Save options and close the dialog. |
| Cancel | Close the dialog without further changes. |
| Defaults | Reset options to the default settings. |
Action Icons
| Clear | Clear all fields and list boxes. | |
| Help | Open the Help topic for this dialog. |