Use this to select the output and graphs to be generated by a Finlay & Wilkinson joint regression analysis.
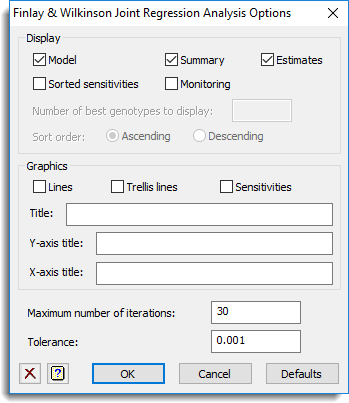
Display
Specifies which items of output are to be displayed in the Output window.
| Model | A description of the model being fitted |
| Summary | An analysis of variance showing the effects of genotypes, environments and sensitivities |
| Estimates | Two tables, the first table is classified by genotypes and contains the unadjusted means, estimated means, standard errors of the estimated means, sensitivities, standard errors of sensitivities, mean square deviations and the ranks of the genotypes according to their sensitivities (the genotype with rank 1 is the one that is least sensitive.); and the second table is classified by environments, and contains estimates of effects, standard errors of estimates, means and the ranks of the environments according to their means. |
| Sorted sensitivities | Displays a table classified by genotypes, containing sensitivities and estimated means with their standard errors, mean square deviations. The rows of the table are sorted into either Ascending or Descending order of sensitivities, according to the setting of the Sort order option. The Number of best genotypes to display option can be set to control the number of genotypes that are included; if unset, they are all printed. If the sort order is Ascending, the number will include genotypes with the lowest sensitivities and if Descending, the number will include genotypes with the highest sensitivities. |
| Monitoring | Display the progress of the search to find the model |
Graphics
Specifies which items to display within a graph.
| Lines | Plots the fitted lines, all on the same graph |
| Trellis lines | Plots the fitted lines in a trellis plot, classified by genotypes |
| Sensitivities | Produces a scatter-plot matrix displaying the sensitivities, the mean square deviations and the estimated means |
The Title, Y-axis title and X-axis title options set the overall title above each plot, and the titles for the y and x axes respectively.
Maximum number of iterations
Specifies the maximum number of iterations that the model fitting process will use.
Tolerance
The criterion controlling the decision when the model fitting has converged. At each iteration, the maximum difference between estimates of the sensitivity parameters in successive iterations is compared to the tolerance: the process ends when the differences are smaller than the tolerance, or when the maximum number of iterations is reached (as set above). Decreasing this will give a more precise fit of the model, but will take more iterations to fit the model. The tolerance must be greater than zero.
Action buttons
| OK | Save the settings and close the dialog. |
| Cancel | Close the dialog without further changes. |
| Defaults | Reset the options to their default settings. |
See also
- Finlay & Wilkinson joint regression analysis menu
- Save options for choosing which results to save
- AMMI menu
- RFINLAYWILKINSON procedure
- AMMI procedure in command mode