Use this to select further output following fitting a Generalized Linear Mixed Model.
Display
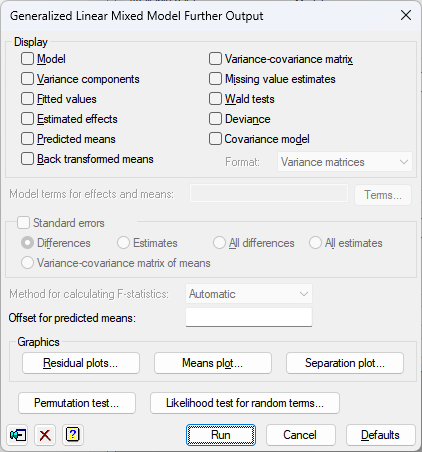
This specifies which items of output are to be displayed.
| Model | Description of the model fitted by the analysis |
| Variance components | Estimates of variance parameters |
| Fitted values | The fitted values and residuals from the model |
| Estimated effects | Estimates of regression coefficients |
| Predicted means | Predicted means |
| Back transformed means | Back transformed means |
| Variance-covariance matrix | Variance-covariance matrix for the variance parameters |
| Missing value estimates | Estimates of missing values |
| Wald tests | Wald Tests for fixed model terms and accompanying F-statistics |
| Deviance | The residual deviance and information selected below |
| Covariance model | Estimated covariance models in the selected format (Variance matrix or Parameters) |
Standard errors
This specifies which standard errors are to be displayed with the tables of means.
| Differences | Summary of standard errors of differences between means |
| Estimates | Summary of standard errors of means |
| All Differences | Full matrix of standard errors between means |
| All Estimates | Full table of standard errors of means |
| Variance-covariance | Variance-covariance matrix for the table |
Method for calculating F-statistics
This controls whether Wald tests for fixed effects are accompanied with approximate F statistics and corresponding numbers of residual degrees of freedom. The computations, using the method devised by Kenward & Roger (1997), can be time consuming with large or complicated models. So, the default setting automatic, can be used to allow Genstat to assess the model itself and decide automatically whether to do the computations and which method to use. The other settings allow you to control what to do yourself:
| none | No F statistics are produced |
| algebraic | F statistics are calculated using algebraic derivatives (which may involve large matrix calculations) |
| numerical | F statistics are calculated using numerical derivatives (which require an extra evaluation of the mixed model equations for every variance parameter). |
Offset for predicted means
Value of offset to use when calculating the means and back-transformed means; if this is not set a default value of 0 will be used.
Model terms for effects and means
This specifies the model terms, as a formula, for which tables of means and/or effects are displayed. For covariates, the associated linear regression parameter can be printed as an effect, but predicted means are not available. Predicted means for other terms are adjusted to the mean of the covariate (but see note below). The formula can include the string ‘Constant’ to include entries for the constant term.
If no formula is specified, means or effects are produced for all the fixed model terms and none of the random terms.
Graphics
The Residual plots button can be used to generate plots of residuals.
The Means plot button can be used to generate plots of the means.
The Separation plot button can be used to generate a plot of the observed versus the fitted probabilities in a separation plot.
Permutation tests
The Permutation test button can be used to run a permutation test, using the GLPERMTEST procedure, to assess the significance of the fixed terms.
Likelihood test for random terms
The Likelihood test for random terms button can be used to run a permutation test,
using the GLRTEST procedure, to assess the significance of the random terms.
Action Icons
| Pin | Controls whether to keep the dialog open when you click Run. When the pin is up |
|
| Clear | Clear all fields and list boxes. | |
| Help | Open the Help topic for this dialog. |
See also
- Generalized Linear Mixed Model menu
- Generalized Linear Mixed Model Options dialog
- Generalized Linear Mixed Model Save Options dialog
- Generalized Linear Mixed Model Predictions dialog
- Generalized Linear Mixed Model Permutation Test dialog
- Generalized Linear Mixed Model Residual Plots dialog
- Separation Plot menu
- GLDISPLAY procedure in command mode for more options
- GLMM procedure
- GLPREDICT procedure
- GLPERMTEST procedure
- GLPLOT procedure
- GLKEEP procedure