The dialog plots the residuals from a generalized linear mixed model analysis.
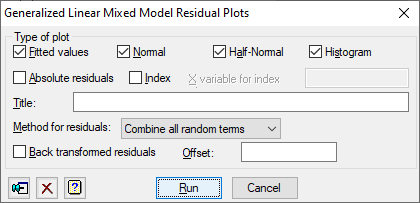
Type of plot
The check boxes in this dialog allow you to select up to 4 types of plot of residuals from a generalized linear mixed model analysis:
| Fitted values | Residuals versus fitted values |
| Normal | Normal plot |
| Half-Normal | Half-Normal plot |
| Histogram | Histogram of residuals |
| Absolute residuals | The absolute values of the residuals versus the fitted values |
| Index | The residuals versus the given x variate |
Title
This provides a title for the plot. If this is not provided, a title will be automatically generated.
Method for residuals
The list allows selection from type of residuals that can be used.
| Combine all random terms | Use the residuals combined from all random terms. |
| Final random term only | Use the residuals from the final random term. |
Back transformed residuals
If this is ticked, residuals on the natural scale (calculated using back-transformed fitted values) will be used in the plots, otherwise standardized residuals on the linear-predictor scale will be used.
Offset
Value of offset to use when calculating the residuals; if this is not set a default value of 0 will be used.
See also
- Generalized Linear Mixed Model menu
- Generalized Linear Mixed Model Options dialog
- Generalized Linear Mixed Model Save Options dialog
- Generalized Linear Mixed Model Further Output dialog
- Generalized Linear Mixed Model Predictions dialog
- Generalized Linear Mixed Model Permutation Test dialog
- GLPLOT procedure in command mode for more options
- GLMM procedure
- GLDISPLAY procedure
- GLPREDICT procedure
- GLPERMTEST procedure
- GLKEEP procedure