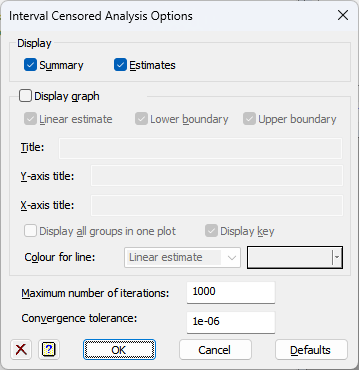
Use this to select the output and graphs to be generated by a Interval Censored Analysis using the TURNBULL procedure.

Display
Specifies which items of output are to be displayed in the Output window.
| Summary | A summary of the data used in each analysis. |
| Estimates | The estimates (linear approximation, lower and upper boundaries) from the fitted Turnbull model. |
Display graph
If this is selected, a graph is displayed of the fitted survival estimates plotted against time. The following options control the display of the graph and the items included in it.
| Linear estimate | Plots the linear approximation to the estimates from the Turnbull model. |
| Lower boundary | Plots the fitted lower boundaries from the Turnbull model. |
| Upper boundary | Plots the fitted upper boundaries from the Turnbull model. |
The Title, Y-axis title and X-axis title options set the overall title above each plot, and the titles for the y- and x-axes respectively. If these titles are not provided, the TURNBULL procedure will provide default titles. Enter a space in any title that you want to be blank.
If Display all graphs in one plot is selected, all the plots will be superimposed in a single plot, with different groups shown using the colours selected for each group in the Colour for group list. Otherwise, the groups are plotted in separate plots, and the Colour for line list can be used to select the colours for the Linear estimate, Lower boundary and Upper boundary items. The colours are edited by using the down-drop list to select a group or graph item, and then clicking the colour button to pop-up the colour selection dialog to select a new colour.
If Display key is selected, a key is added to the bottom of the plot(s). Otherwise no key is displayed, and the graphs use the full square frame.
Maximum number of iterations
Specifies the maximum number of iterations used to fit the model. This must be a positive integer.
Convergence tolerance
This defines the criterion controlling the decision about when the model fitting has converged. At each iteration, the maximum difference between estimates in successive iterations is compared to the tolerance: the process ends when the differences are smaller than the tolerance, or when the maximum number of iterations is reached (as set above). Decreasing this will give a more precise fit of the model, but will take more iterations to fit the model. The tolerance must be greater than zero.
Action buttons
| OK | Save the settings and close the dialog. |
| Cancel | Close the dialog without further changes. |
| Defaults | Reset the options to their default settings. |
See also
- Interval Censored Analysis menu
- Store options for choosing which results to save
- Kaplan-Meier (Interval based)
- Life-table menu for forming life-tables
- Nonparametric Survival Tests menu for nonparametric survival tests
- Survival Distributions menu
- Proportional Hazards menu
- TURNBULL procedure
- KAPLANMEIER procedure