Select menu: Stats | Survival Analysis | Kaplan-Meier
Calculates the Kaplan-Meier estimate of the survivor function, using data recorded at the end of specified time-intervals.
- After you have imported your data, from the menu select
Stats | Survival Analysis | Kaplan-Meier. - Fill in the fields as required then click Run.
You can set additional Options then after running, you can save the results by clicking Save.
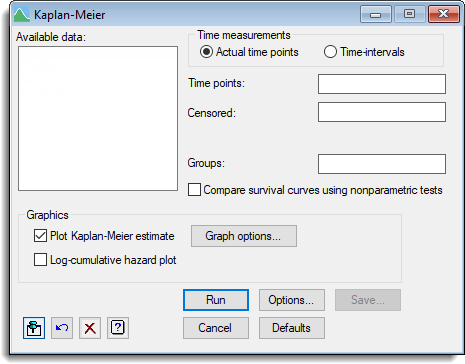
Available data
This lists data structures appropriate to the current input field. It lists variates for specifying the data, and factors for the group. The contents will change as you move from one field to the next. Double-click a name to copy it to the current input field or type the name.
Time points
The time points at the end of each interval.
Number at risk
Variate specifying the number at risk at the end of each interval.
Number of deaths
Variate specifying the number of deaths at the end of each interval.
Groups
This can be used to indicate different groups whose survivor functions are to be estimated separately.
Plot Kaplan-Meier estimates
Plots the Kaplan-Meier estimate against the time points.
Log-cumulative hazard plot
Plots the Log-cumulative hazard against the log of the time points.
Graph options
Lets you specify titles and control settings for the plot.
Action Icons
| Pin | Controls whether to keep the dialog open when you click Run. When the pin is down |
|
| Restore | Restore names into edit fields and default settings. | |
| Clear | Clear all fields and list boxes. | |
| Help | Open the Help topic for this dialog. |
See also
- Kaplan-Meier (Exact time points)
- Kaplan-Meier Options
- Kaplan-Meier Save
- KAPLANMEIER procedure in command-mode
- Life-table menu for forming life-tables
- Nonparametric Survival Tests menu for nonparametric survival tests
- Survival Distributions
- Proportional Hazards