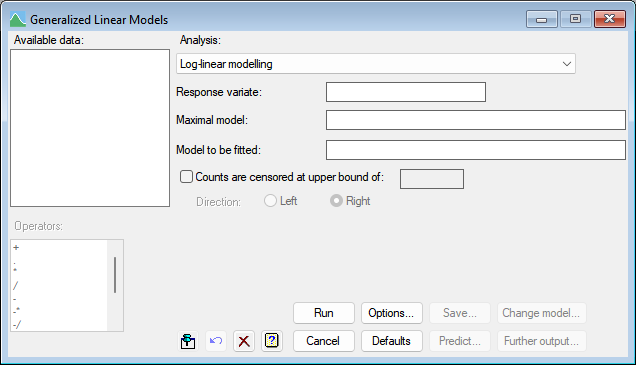
Select menu: Stats | Regression Analysis | Log-linear Models
Log-linear modelling is appropriate for data consisting of counts, which are assumed to come from Poisson distributions.
- After you have imported your data, from the menu select
Stats | Regression Analysis | Log-linear Models. - Fill in the fields as required then click Run.
You can set additional Options then after running, you can save the results by clicking Save.

The probabilities of the distributions are studied by fitting linear models on the logarithmic scale; that is, in the terminology of generalized linear models, there is a logarithmic link function between the expected counts and the combination of linear effects. This link implies that the underlying model is multiplicative, so the effect of a treatment, for example, will be to produce a proportionate increase (or decrease) in the expected counts rather than to add (or subtract) a constant amount.
Response variate
The name of the variate containing the observed counts needs to be entered into the Response variate field, and can be selected from those in the Available data list.
Maximal model
The Maximal model lets you specify the most complicated model that you are likely to want to consider. It may be left blank, but this may lead to subsequent inability to compare models because of data that are missing for some explanatory variates but not for others.
Model to be fitted
The model to be fitted is specified by entering a model formula into the Model to be fitted field. The formula can involve both variates and factors which can be selected from the Available data field, and operators from the Operators field.
Censored data
When the option Censored are censored option is ticked, you can set a censoring value in upper bound (Direction: Right) or lower bound (Direction: Left) field at which values are censored. Right censoring means that you are certain the value is at least as great as the bound, but may be higher. This may occur when it is not possible to count above a particular value. Left censoring means that you are certain the value is at most as large as the bound, but may be lower. This may occur if you can not detect less than a given count.
Action buttons
| Run | Run the analysis. |
| Cancel | Close the dialog without further changes. |
| Options | Opens a dialog where additional options and settings can be specified. |
| Defaults | Reset to the default settings. Clicking the right mouse on this button produces a shortcut menu where you can choose to set the options using the currently stored defaults or the Genstat default settings. |
| Save | Opens a dialog where you can save results from the analysis. |
| Predict | Lets you calculate predictions based on the current regression model. |
| Change model | This changes the current model by adding or dropping explanatory terms, thus allowing a sequence of models to be fitted and assessed. If you specified a maximal model, all new terms must have appeared in that model. If you did not specify a maximal model and a term is introduced with a missing value for a unit previously used in the regression, the model sequence is interrupted and information will be available only for the current model (excluding that unit) and the new model. |
| Further output | Lets you display additional results and graphical output from the analysis. |
Action Icons
| Pin | Controls whether to keep the dialog open when you click Run. When the pin is down |
|
| Restore | Restore names into edit fields and default settings. | |
| Clear | Clear all fields and list boxes. | |
| Help | Open the Help topic for this dialog. |
See also
- Generalized Linear Models for information on general options and other models
- Options for optional settings and display
- Further Output for additional output subsequent to analysis
- Saving Results for further analysis
- Fitted Model for graphical display of the model
- Model Checking for diagnostic plots for model checking
- RTOBITPOISSON procedure