
Use this to select the output to be generated from fitting a model to the experimental variogram.
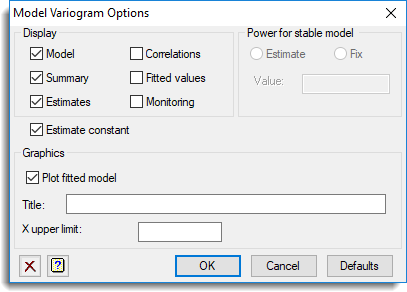
Display
| Model | Details of the model that is fitted |
| Summary | Summary analysis of deviance |
| Estimates | Estimates of the parameters in the model |
| Correlations | Correlations between the parameter estimates |
| Fitted values | Table containing the values of the response variate, fitted values, standardized residuals and leverages |
| Monitoring | Reports progress of the fit |
Estimate constant
Specifies whether to include a constant in the model.
Power for stable model
Controls whether the power for the stable model is supplied or estimated from the data. Select Estimate to estimate the power from the data. Alternatively, select Fix to supply a value for the power by entering the value in the space provided.
Graphics
Specifies whether to display a plot of the data and the fitted model. You can also give a title and a value for the upper value of the x-axis (i.e. distance).
See also
- Model Variogram menu
- Model Variogram Initial Values menu
- Model Variogram Options
- Form Variogram menu
- Krige menu
- Krige Options
- Krige Store Options
- DVARIOGRAM procedure
- MVARIOGRAM procedure