Select menu: Stats | Spatial Analysis | Nearest Neighbour Analysis
This menu analyses a field trial whose plots are arranged linearly in blocks using a one-dimensional nearest neighbour analysis, similar to that of Stroup & Mulitze (1991, American Statistician, 45, 194-200). However, to avoid bias, it estimates the variance parameters by residual maximum likelihood (REML) rather than ordinary maximum likelihood.
- After you have imported your data, from the menu select
Stats | Spatial Analysis | Nearest Neighbour Analysis. - Fill in the fields as required then click Run.
You can set additional Options before running the analysis and store the results by clicking Store.
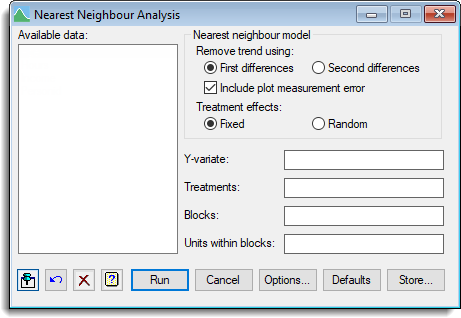
The data variate to be analysed is specified in the Y variate field, and a single treatment factor can be specified in the Treatments field. The Blocks field specifies the block factor, which defines the groups of plots that are to be detrended separately. The blocks need not all be the same length. The Units within blocks field specifies the units-within-blocks factor, which defines the order of the plots within each block.
For example, if the plots are on a rectangular grid and trends are to be removed along rows, the blocks and units-within-blocks factors would be the row and column factors, respectively. If these two fields not set, the plots are assumed to be in a single line (and specified sequentially down the line).
The original method of nearest-neighbour analysis, due to Papadakis (see the VNEARESTNEIGHBOUR procedure for references), can be approximated by selecting First differences with Include plot measurement error not ticked. However, this analysis is an improvement on the Papadakis method, as the treatments effects and the trend are estimated jointly, instead of estimating the spatial effects from the unadjusted treatment effects (i.e. ignoring any trend).
Available data
This lists the available structures, matching the required type of the current input field (either Y variate, Treatments, Blocks or Units within blocks). Double-clicking an identifier name copies it into the edit box with current focus, and then moves the focus to the next input field.
Remove trend using
This specifies the model that is used for detrending each block.
| First differences | This fits a Linear Variance model that assumes the variation between plots increases linearly with distance between the plots so that Var(yi – yj) = |i – j|σ12 + 2σ2. The first differences yi – yi-1 are formed and modelled with one or two variance components. This is equivalent to modelling the data as a random walk. |
| Second differences | The second differences 2yi – yi-1 – yi+1 are formed and modelled with one or two variance components. This assumes a smoother trend than the first difference model. |
Include plot measurement error
If this is selected, a variance component is included that models a measurement error on each plot. These induce a correlation between the differences for adjacent plots. Otherwise, the error model assumes that the first or second differences have independent Normal errors.
Treatment effects
| Fixed | The effects of the treatment factor are estimated as fixed effects. |
| Random | The effects of the treatment factor are treated as a random sample from a single underlying distribution with a variance that is estimated by REML. |
Y-variate
Specifies a variate containing the data values.
Treatments
A factor specifying the treatments applied to each plot. If you have a factorial experiment, either form the factor product of the multiple treatment factors, or use the REML spatial analysis menus instead.
Blocks
This gives a factor that groups the units into blocks. Each block is detrended using the selected model. If all the data are in one block and are already in block order, this can be left empty.
Units within blocks
This indexes the plots within each block. The ordinal levels of the factor within each block should be 1…n, where n is the size of the block i.e. you must reuse the same levels within each block rather than numbering the plots across the whole trial.
Action buttons
| Run | Run the analysis. |
| Cancel | Close the dialog. |
| Options | Open the Options dialog. |
| Defaults | Reset the options to their defaults. Right clicking on this button allows the selection of either User or Genstat defaults. |
| Store | Open the Store dialog to save output from the analysis. |
Action Icons
| Pin | Controls whether to keep the dialog open when you click Run. When the pin is down |
|
| Restore | Restore names into edit fields and default settings. | |
| Clear | Clear all fields and list boxes. | |
| Help | Open the Help topic for this dialog. |
See also
- Options dialog for specifying options.
- Store dialog for saving the results from the analysis.
- REML Spatial Model Regular Grid menu.
- REML Spatial Model Irregular Grid menu.
- FACPRODUCT procedure.
- VNEARESTNEIGHBOUR procedure.