Select menu: Stats | Mixed Models (REML) | Spatial Models | Regular Grid
This provides facilities for the analysis of two-dimensional data in the form of a regular rectangular grid using the method of residual maximum likelihood (REML), which is also sometimes called restricted maximum likelihood. The data should be supplied in a single variate with factors to specify the rows and columns of the rectangular grid. There should be exactly 1 observation for each point on the grid.
- After you have imported your data, from the menu select
Stats | Mixed Models (REML) | Spatial Models | Regular Grid.
OR
Stats | Spatial Analysis | Regular Grid (REML). - Fill in the fields as required then click Run.
You can set additional Options then after running, you can save the results by clicking Save.
Available data
This lists data structures appropriate to the current input field. The contents will change as you move from one field to the next. Double-click on a name to copy it to the current input field or type the name.
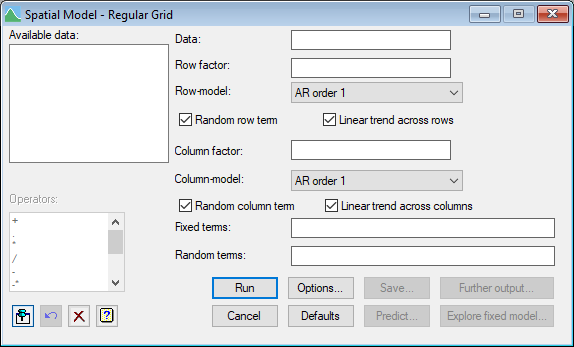
Data
Specifies a variate containing the data values.
Row factor
A factor specifying the rows in the regular grid.
Row-model
Lists the available correlation models. Select the correlation model that you want to apply across rows of the grid.
Random row term
Specifies whether you want to fit a random row effect in addition to the row model.
Linear trend across rows
Specifies whether you want to fit a linear trend across rows.
Column factor
A factor specifying the columns in the regular grid.
Column-model
Lists the available correlation models. Select the correlation model that you want to apply across columns of the grid.
Random column term
Specifies whether you want to fit a random column effect in addition to the column model.
Linear trend across columns
Specifies whether you want to fit a linear trend across columns.
Fixed model
The fixed model describes imposed treatment factors and covariates for which the effect of specified levels or values are of interest. The model is described using a formula, which can combine main effects and interactions of factors and also covariates.
Random model
The random model is generally used to describe those factors for which the values present in an experiment can be considered drawn from some large homogeneous population. The model is described using a formula, which can combine main effects and interactions of factors and also covariates.
Operators
This provides a quick way of entering operators in the fixed and random model formulas. Double-click on the required symbol to copy it to the current input field. You can also type in operators directly. See model formula for a description of each operator.
Action buttons
| Run | Run the analysis. |
| Cancel | Close the menu without further changes. |
| Options | Opens a dialog where additional options and settings can be specified for the analysis. |
| Defaults | Set the menu settings back to the default settings. Clicking the right mouse on this button produces a shortcut menu where you can choose to set the options using the currently stored defaults or the Genstat default settings. |
| Save | Opens a dialog where you can save results from the analysis. |
| Predict | Allows you form predictions based on the current model. |
| Further output | Opens a dialog for specifying further output from the analysis and displaying residual and means plots. |
| Explore fixed model | Opens a dialog for exploring the fixed model from the analysis. This allows you try different subsets of the fixed model to see which terms are important |
See also
- Options for specifying output options.
- Further output for additional output after fitting a model.
- Save for saving the results from a REML analysis.
- Spatial Model – Irregular Grid menu.
- REML directive for command mode use of REML, with additional options to control the algorithm and for more sophisticated analyses.
- REML Predictions menu for forming predictions.
- Explore fixed model dialog for exploring which terms are important in the fixed model.