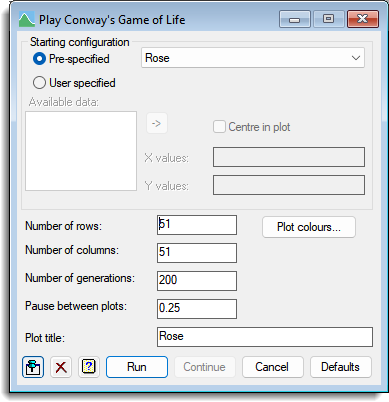
This menu allows you to play the classic game of life, created by John Conway, using the LIFE procedure.
- From the menu select Data | Games | Life.
In this you set a starting configuration of individuals in an grid of cells, and then the rules of life are applied to the individuals to create the next generation. The size of the grid is given in the Number of rows and Number of columns fields. Points that leave the grid are assumed to be dead which can create edge effects. The location of the individuals in the grid is plotted for each generation. This is repeated until all individuals have died, are static or the Number of generations has been reached.
If you have reached the Number of generations, you may use the Continue button to keep running the population for more generations. The Pause option controls how quickly the generations are plotted. The menu contains 33 Pre-specified starting configurations, or you may provide your own pair of variates that specify the X and Y locations of the individuals in the grid.
Rules of life
- Any live cell with fewer than two live neighbours dies (exposure).
- Any live cell with more than three live neighbours dies (overcrowding).
- Any live cell with two or three live neighbours lives, unchanged, to the next generation.
- Any dead cell with exactly three live neighbours will come to life (birth).
Pre-specified
Specifies a named configuration to use as the starting configuration. For the Random configurations two fields Size and Points come up and specify the maximum extent of the square or line and the number of points randomly allocated within this. For the Random configurations, the starting X and Y variates are printed in the Output window in case you find an interesting one that you want to record. Some of the patterns die, others become oscillators that switch between a set number of states. This may be as few as two for the simple Blinker, Beacon and Toad, or may be large as in the Centinal (100). Other patterns move consistently across the grid e.g the Glider, Spaceships and Invader. Some patterns are generative, such as the Gospor Glider Gun or the Space filler, and grow indefinitely. Some large patterns die quickly, and other small ones like the R-pentomino may live indefinitely.
User specified
Select this option to provide your own configuration in the X values and Y values fields.
Available data
This lists variates appropriate to the X values or Y values fields. When in the Y values field, only variates with the same length as the current X values field will be listed. Double-click a name to copy it to the current field or type the name. You can also transfer the current selection by clicking the ![]() button.
button.
X values
This gives the X (column) locations of the starting individuals. The values must be between 1 and the Number of columns. Column 1 is on the left of the grid. This may be a variate or a space or comma separated list of numbers. The usual Genstat continuation notation … and multipliers, n(), can be used in the list, e.g. 2(1…5).
Y values
This gives the Y (row) locations of the starting individuals. The values must be between 1 and the Number of rows. Row 1 is at the bottom of the grid. This may be a variate or a space or comma separated list of numbers. The usual Genstat continuation notation … and multipliers, n(), can be used in the list, e.g. 2(1…5).
Centre in plot
If this option is ticked, the X and Y variate values are moved so that their mean lies at the centre of the plot. This allows you to use small values 1…n to specify a configuration, but then start it running with blank space around it.
Number of rows
Lets you specify the number of rows in the grid. If a pre-specified configuration will not fit in the given number of rows, this will be increased.
Number of columns
Lets you specify the number of columns in the grid. If a pre-specified configuration will not fit in the given number of columns, this will be increased.
Number of generations
This gives the maximum number of generations that will be displayed. The plots will stop before this if all individuals have died or are static. You may use the Continue button to keep running the population if you have reached the maximum number of generations.
Pause
This controls the pause in seconds between displaying plots in the Graphics Viewer. The speed of display depends on how the speed of your computer and the size of the grid. So, even if this is zero, there may be an appreciable delay between plots.
Plot title
This gives a title for the plot. If a Pre-specified selection is made, its name is automatically copied into here. However, the title can then be modified after the selection has been made. When changing to a User specified configuration, the title is initially cleared.
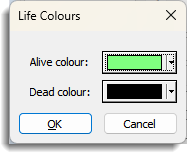
Plot Colours
This allows you to change the colours used to plot the cells. It will open a dialog as shown below. Click either button to get the colour picker box to change the colours for the Alive colour or Dead colour.
Action buttons
| Run | Run the game. |
| Continue | Continue the current configuration on the specified Number of generations. The Number of generations, Pause and Plot title fields may be changed before using this button. |
| Cancel | Close the menu without further changes. |
| Defaults | Set the menu settings back to the default settings (those last used when clicking Run). Clicking the right mouse on this button produces a shortcut menu where you can choose to set the options using the currently stored user defaults or the Genstat default settings. |
Action Icons
| Pin | Controls whether to keep the dialog open when you click Run. When the pin is up |
|
| Clear | Clear all fields and list boxes. | |
| Help | Open the Help topic for this dialog. |
See also
- Play Bingo menu.
- Play Fruit Machine menu.
- Play Noughts and Crosses menu.
- Data menu
- LIFE procedure.
- DCLOSE directive.
- DSHADE directive.