This calculates the power for a given design, i.e. for a given level of response between two treatment groups and confidence level, it will calculate the probability of detecting this response. The design used is that specified in the Generate a Standard Design dialog.
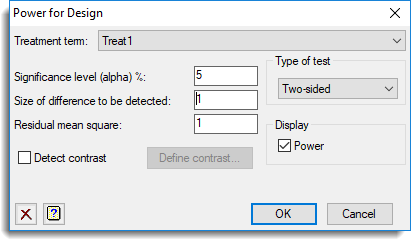
Treatment term
A dropdown list of the treatment terms in the current design. The calculated power will be for a difference between two means in this treatment means table.
Significance level (alpha)%
Significance level as a percentage (0-100) at which the response is required to be detected. The default is 5%.
Size of difference to be detected
Size of the difference between treatment effects that is to be detected.
Residual mean square
This the residual mean square expected for the stratum that contains the selected treatment term (evaluated from previous experience). If you have similar studies, these can be estimated from an analysis of variance. You can display the stratum variances from an analysis of variance to see the required values, or alternatively you can examine the analysis of variance table.
Detect contrast
Calculate the power of a specified contrast between means in the treatment terms. Click Define contrast to open a menu where you can define a contrast variate.
Type of test
Specifies the type of test. You can use a One-sided or Two-sided t-test. Alternatively, if you select F-ratio the size of difference is taken to be the maximum difference between the effects of treatment term, and uses an F-test. The other settings enable you to test for Equivalence or Non-inferiority. With equivalence, the size of difference provides a threshold below which the treatments can be assumed to be equivalent. For example, if the treatments have effects e1 and e2, the null hypothesis that the treatments are not equivalent is that either
(e1 – e2) ≤ – size of difference
or
(e1 – e2) ≥ – size of difference
with the alternative hypothesis that they are equivalent, i.e.
-size of difference < (e1 – e2) < size of difference
With non-inferiority, the size of difference again specifies the threshold for the effect of one treatment to be superior to another. For example, to demonstrate non-inferiority of treatment 1 compared to treatment 2, the null hypothesis becomes
(e1 – e2) ≥ -size of difference
which represents a simple one-sided t-test.
Display
Specifies which items of output are to be displayed in the Output window.
| Power | Display the probability of detection (power) |
See also
- Generate a Standard Design
- Define contrast variate menu for creating contrasts
- APOWER procedure for calculating the power for an analysis of variance using the command language