This dialog specifies options for the Probability Distribution Plot.
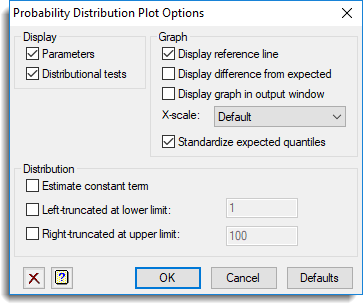
Display
Specifies the output to be displayed.
| Parameters | Displays the fitted parameters of the specified distribution and some sample statistics of the observed data. |
| Distributional tests | Displays results from 3 empirical tests (the Anderson-Darling, Cramer-von Mises and Watson statistics), that test how well the observed cumulative probability density (cdf) fits the theoretical cdf. |
Display reference line
When plotting the data against the expected values, selecting this option allows the 1-1 line to be added to the graph, so that departures from this can be more easily observed.
Display difference from expected
Selecting this option plots the difference between the data and the expected values, so that departures can be observed more easily in a horizontal direction rather than on a 45 degree slant.
Display graph in output window
Select this option to plot a character based graph in the Output window rather than in the default high resolution graphics menu.
Estimate constant term
Some distributions (Log-Normal, Gamma, Weibull, Beta type 1, Beta type 2 and Pareto) can have an extra parameter (a) estimated, so that X-a follows the specified distribution. Selecting this option will estimate a value for a.
Left truncated at lower limit
Some distributions (Normal, Log-Normal, Gamma, Inverse Gamma, Log-Gamma, Weibull, Inverse Weibull, Pareto, Generalized Pareto, Log-Logistic, Paralogistic, Burr, Inverse Burr) can be estimated when the data is truncated below a given threshold, i.e. data from the original distribution are discarded if they fall below this value. For example, in insurance data, when claims are less than the policy excess, they are never lodged. If this option is selected, the distribution will be fitted, assuming all values less than the given lower limit have been excluded. The specified lower limit must be less than the minimum data value.
Right truncated at upper limit
Some distributions (Normal, Log-Normal, Gamma, Inverse Gamma, Log-Gamma, Weibull, Inverse Weibull, Pareto, Generalized Pareto, Log-Logistic, Paralogistic, Burr, Inverse Burr) can be estimated when the data is truncated above a given threshold, i.e. data from the original distribution are discarded if they fall above this value. If this option is selected, the distribution will be fitted, assuming all values greater than the given upper limit have been excluded. The specified upper limit must be greater than the maximum data value.