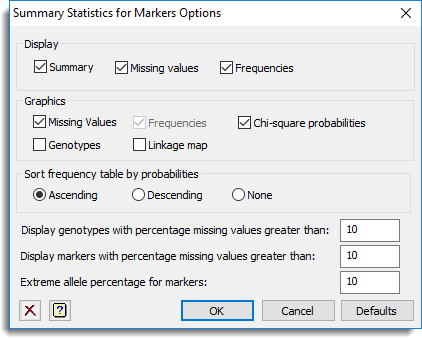
Use this to specify options for descriptive statistics and diagnostic plots for marker scores.
Display
This specifies which items of output are to be produced by the analysis.
| Summary | A summary of the analysis |
| Missing values | Displays the genotypes and markers where the percentage of missing values exceeds the given thresholds. |
| Frequencies | For an association mapping population this displays the allele frequencies of all markers where the allele frequencies exceeds the given threshold. For F2, BC1, DH, BCxSy or RIL populations the frequencies of genotype codes for each marker are displayed along with the chi-square tests of Mendelian segregation. |
Sort frequency table by probabilities
For F2, BC1, DH, BCxSy or RIL populations the table of frequencies can be sorted using the probabilities from the chi-square tests of Mendelian segregation. You can sort the table in Ascending or Descending order, or alternatively select the None setting to leave the table unsorted.
Graphics
This controls the type of diagnostic plots that are to be produced.
| Missing values | Produces a trellis plot of percentages of missing values against the map position for each linkage group and a plot of missing marker scores. |
| Frequencies | Produces a trellis plot of the allele frequencies against the map position for each linkage group (for an association mapping population only). |
| Chi-square probabilities | Produces a trellis plot of the chi-square probabilities, plotted on a -log10 scale against the map position for each linkage group (for F2, BC1, DH or RIL populations only). |
| Genotypes | Produces a plot of the genotypes. |
| Linkage map | Produces a linkage map. |
Display genotypes with percentage missing values greater than
Specifies a threshold for displaying genotypes with many missing values (i.e. genotypes with a higher percentage of missing values than the specified value).
Display markers with percentage missing values greater than
Specifies a threshold for displaying markers with many missing values (i.e. markers with a higher percentage of missing values than the specified value).
Extreme allele percentage allowed for markers
Specifies a threshold for printing markers with rare alleles (i.e. alleles present with a lower percentage than the specified threshold).
Action buttons
| OK | Stores the option settings and closes the dialog. |
| Cancel | Close the dialog without making any changes. |
| Defaults | Sets the options to their default settings. |
Action Icons
| Clear | Clear all fields and list boxes. | |
| Help | Open the Help topic for this dialog. |
See also
- Summary statistics for markers menu.
- QTL data space for using data in QTL menus
- Genotype data plot menu.
- Display genetic map menu.
- QMKDIAGNOSTIC procedure in command mode