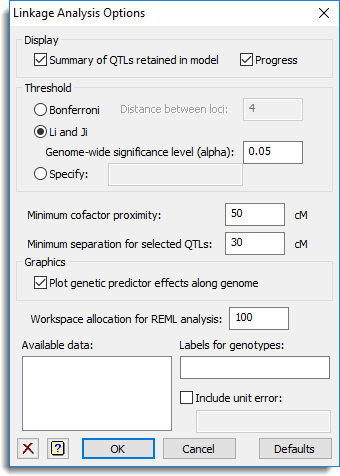
Use this to specify options for a single- or multi-trait linkage analysis in a single or multiple environment.

Display
This specifies which items of output are to be produced by the analysis.
| Summary of QTLs retained in model | Produces a summary of the QTLs that are retained in the model |
| Progress | Produces monitoring output detailing the progress of the analysis |
Threshold
Specifies the threshold method to use. Select Bonferroni for the Bonferroni method, which assumes independent tests occur at a fixed distance on the genome, where this distance must be supplied in the space provided. Alternatively, select Liji for the method of Li & Ji or Specify to supply your own threshold value in the space provided. For more details about the threshold methods see the QTHRESHOLD procedure. The Bonferroni and Liji methods use a genome-wide error rate that can be supplied using the Genome-wide significance level (alpha) option.
Minimum cofactor proximity
Cofactors that are close to a (virtual) marker being tested cannot be included in the model due to problems with collinearity. This option specifies a window around each marker such that cofactors within that window are excluded from the model for that marker. Setting this to a large value, i.e. 106, means that the window excludes all cofactors on the same chromosome as the marker.
Minimum separation for selected QTLs
Minimum distance in cM between peaks that can be selected as QTL candidates: if two peaks are closer together than this minimum separation, then only one will be taken forward as a candidate position.
Graphics
This specifies whether plots are to be produced by the analysis.
| Plot genetic predictor effects along genome | Plots the test statistic associated with the effects of the genetic predictors against their position on the chromosomes. |
Workspace allocated for REML analysis
To perform a genome-wide scan for QTL effects a mixed model is repeatedly fitted along the genome. Occasionally for large data sets an error message may appear reporting that the numerical data space is full. This option provides a way of increasing the workspace required for the mixed model analysis. For more details about the REML workspace see the REML directive.
Available data
This lists text data structures currently available in Genstat appropriate for the labels for genotypes or unit error. Double-click a name to copy the it to the current input field or type the name.
Labels for genotypes
A text specifying labels for the genotypes that correspond with the labels for the genotypes for the phenotypic means. This data structure can be used to ensure that there is correct matching for the genotypes between genotypic and phenotypic data. If a data structure exists in the QTL data space for the labels for genotypes then this will be automatically entered in the field.
Include unit error
When selected for a single trait linkage analysis a variate can be supplied for the unit error to represent uncertainty on trait means (derived from individual unit or plot error) to be included in a QTL analysis. If a unit error data structure has been stored in the QTL data space then the name of that structure will be automatically entered into the input field. For multi-trait linkage analysis when this option is selected any unit errors that are stored within the QTL data space for the different traits will be used in the analysis.
Action buttons
| OK | Stores the option settings and closes the dialog. |
| Cancel | Close the dialog without making any changes. |
| Defaults | Sets the options to their default settings. |
Action Icons
| Clear | Clear all fields and list boxes. | |
| Help | Open the Help topic for this dialog. |
See also
- QTL data space for using data in QTL menus
- Single trait linkage analysis (single environment) menu.
- Multi-trait linkage analysis (single environment) menu.
- Single trait linkage analysis (multiple environment) menu.