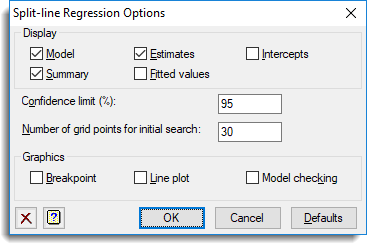
Use this to set options for a split-line regression.

Display
Specifies the output to be displayed.
| Model | Displays the model. |
| Summary | Summary of the analysis. |
| Estimates | Displays estimates of the parameters and confidence interval for the x location of the intersection (or breakpoint) of the lines. |
| Fitted values | Displays the fitted values. |
| Intercepts | Displays the x-value at which the model intercepts the y-axis, and the y-value at which it intercepts the x-axis. |
Confidence limit (%)
Specifies the confidence limit for the x location of the intersection (or breakpoint) of the lines. This value should be supplied as a percentage.
Number of grid points for initial search
Specifies the number of grid points used in the initial search for the best point.
Graphics
Specifies the plots to be displayed.
| Breakpoint | Partial likelihood plot displaying the approximate F ratio for the model for a range of positions of the breakpoint between the lines. |
| Lines plot | Lines plot of the fitted lines. |
| Model-checking | Composite plot of a histogram, Normal plot, half-Normal plot and residuals against fitted values. |
See also
- Split-line Regression menu
- Split-line Regression Save Options menu
- R2LINES procedure in command mode