Select menu: Data | Reshape or Spread | Manipulation | Reshape.
This reshapes data sets using the RESHAPE procedure.
- After you have imported your data, from the menu select
Data | Reshape or Spread | Manipulation | Reshape. - Fill in the fields as required then click Run.
You can set additional options by clicking Options.
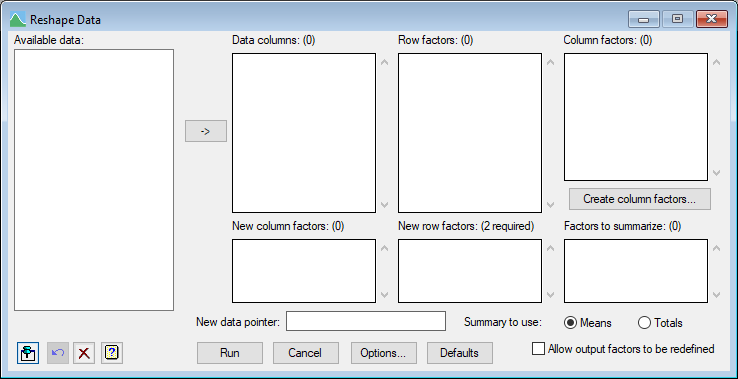
The data set is defined by a set of data columns with row and column factors identifying the observations within these. This menu is useful when rows and columns in a data set are to be swapped to another dimension (rows to columns or vice-versa). The data columns are stacked into a single column, with factors indexing the resulting rows created from the original row and column factors. It is then unstacked by one or more of these factors (the New Column factors) to reshape the data. For example, if you have variates containing different measurements taken at several different times, one column factor could index the measurements and another the times. Also, the data can be collapsed across some of the factors by taking totals or means.
When the menu is opened from the Spread | Manipulation | Reshape menu, only the columns in the spreadsheet will display in the Available data list for Data columns and Row factors lists.
Available data
This lists variates, factors and texts that are available to go into one of the lists. Double-click a name to copy it to the current input field or type the name. You can select multiple items using the Ctrl and Shift keys, and move them to the list in one action by clicking the arrow button ![]() . After the first data column is selected, only columns of this length will be displayed when focus is on the Data columns and Row factors lists. When focus is on the Column factors list, only variates, factors and texts which are the same length as the number of columns in the Data columns list will display. When focus is on the New column factors or New row factors or Factors to summarize lists, only items which are in either Row factors or Column factors lists are displayed. When the focus is on the New data pointer only pointers will be displayed.
. After the first data column is selected, only columns of this length will be displayed when focus is on the Data columns and Row factors lists. When focus is on the Column factors list, only variates, factors and texts which are the same length as the number of columns in the Data columns list will display. When focus is on the New column factors or New row factors or Factors to summarize lists, only items which are in either Row factors or Column factors lists are displayed. When the focus is on the New data pointer only pointers will be displayed.
Data columns
This lists the structures (variates, factors and texts) that identify the data in the rows of the data matrix. Any variate or text given here will be converted to a factor in the resulting data set. If no structure is given, a default factor Rows is created. You can type the names in directly, or double-click names from the Available data list, or select multiple entries in the Available data list and use the arrow button ![]() .
.
Row factors
Specify the names for the structures that identify the rows in the data matrix. Any variate or text given here will be converted to a factor in the resulting data set. If no structure is given, a default factor Rows is created. You can type the names in directly, or double-click names from the Available data list, or select items and use the arrow button ![]() . Each of the items in this list must be presented only once in one of New column factors, New row factors or Factors to summarize lists.
. Each of the items in this list must be presented only once in one of New column factors, New row factors or Factors to summarize lists.
Column factors
Specify the names for the structures that identify the columns in the data matrix. You can type the names in directly, or double-click names from the Available data list, or select multiple entries in the Available data list and use the arrow button ![]() . Only structures which are the same length as the number of columns in the Data columns list should be used. If you do not have structures for identifying the data columns already, you can use the Create column factors button which will create a spreadsheet the same length as the number of items in the Data columns list. The first column of this spreadsheet will contain the structure names and you can rename and fill in columns or add new ones to create column factors, as described below. Each of the items in this list must be presented only once in one of New column factors, New row factors or Factors to summarize lists.
. Only structures which are the same length as the number of columns in the Data columns list should be used. If you do not have structures for identifying the data columns already, you can use the Create column factors button which will create a spreadsheet the same length as the number of items in the Data columns list. The first column of this spreadsheet will contain the structure names and you can rename and fill in columns or add new ones to create column factors, as described below. Each of the items in this list must be presented only once in one of New column factors, New row factors or Factors to summarize lists.
Create column factors
This button which will create a spreadsheet the same length as the number of items in the Data columns list. The first column of this spreadsheet will contain the structure names and the other two blank columns allow multiple factors to be given. The first column may not need to be used in the Reshape menu, but is there for reference as you create other columns. You can Rename the columns and type into or fill columns to provide the information to index the columns. You can use the Spread | Insert menu to add more columns if you need more than 3 column factors. If the names of the data columns contain information that you want to split into multiple factors (e.g. Ht1, Ht2, Ht3, Wt1, Wt2, Wt3 for height and weight measured at three times), the Spread | Calculate | Text Split menu may be useful for this. Any column type (text, variate or factors) can be used from the spreadsheet, as these will be converted into factors when used.
New column factors
Specify the names for the factors in the Row factors or Column factors lists that identify the columns in the reshaped data matrix. You can type the names in directly, or double-click names from the Available data list, or select multiple entries in the Available data list and use the arrow button ![]() . If this is empty, the resulting reshaped data set will only have one column of data.
. If this is empty, the resulting reshaped data set will only have one column of data.
New row factors
Specify the names for the factors that identify the rows in the reshaped data matrix. The heading of the list will show the number of entries required for this list. There must be a new name for each structure in the Row factors or Column factors lists that is not in either of the New column factors or Factors to summarize lists. The order of the factors saved will be taken from the order in the Row factors followed by that in Column factors list. You can type the names in directly, or double-click names from the Available data list, or select multiple entries in the Available data list and use the arrow button ![]() . If Allow output factors to be redefined is selected, you can reuse the row and column factor names (and these structures will be overwritten). When the option Allow output factors to be redefined is not selected, the names in this list must not appear in any of the row or column factor entries. Items from the Available data list are then renamed to make then unique (e.g. Treat would be changed to Treat_1).
. If Allow output factors to be redefined is selected, you can reuse the row and column factor names (and these structures will be overwritten). When the option Allow output factors to be redefined is not selected, the names in this list must not appear in any of the row or column factor entries. Items from the Available data list are then renamed to make then unique (e.g. Treat would be changed to Treat_1).
Factor to summarize
Specify the names for the structures in the Row factors or Column factors lists that give factors whose groups are to be summarized. Only structures in either the Row factors list or the Column factors list can be used in this list. The name must be followed by a space and then the statistic Means or Totals. Only the first letter of the statistic is significant, and this can be in either upper or lower case. If no statistic is given after the name, then the default option, Means is used. You can type the names in directly, or double-click names from the Available data list, or select multiple entries in the Available data list and use the arrow button ![]() . If you double-click entries or use the arrow button
. If you double-click entries or use the arrow button ![]() , the name of the summary statistic selected by the Summary to use option Means or Totals is placed after the names.
, the name of the summary statistic selected by the Summary to use option Means or Totals is placed after the names.
New data pointer
Give the name of a pointer to hold the data columns in the reshaped data matrix. You can type the name in directly, or double-click a name from the Available data list, or select an entry in the Available data list and use the arrow button ![]() .
.
Action buttons
| Run | Run the reshaping of the data matrix. |
| Cancel | Close the menu without further changes. |
| Options | Opens a dialog where additional options and settings can be specified. |
| Defaults | Set the menu settings back to the default settings. Clicking the right mouse on this button produces a pop-up menu where you can choose to set the menu using the currently stored defaults or the Genstat default settings. |
Action Icons
| Pin | Controls whether to keep the dialog open when you click Run. When the pin is down |
|
| Restore | Restore names into edit fields and default settings. | |
| Clear | Clear all fields and list boxes. | |
| Help | Open the Help topic for this dialog. |
Example
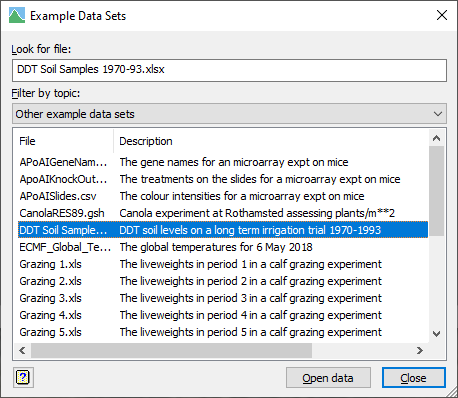
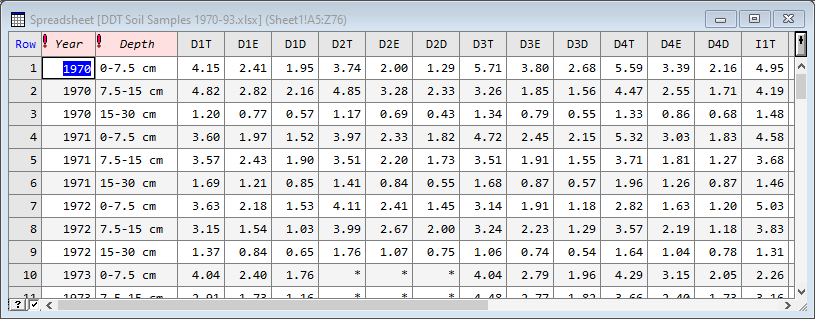
The file ‘DDT Soil Samples 1970-93.xlsx‘ contains levels of DDT pesticide in soil samples from a long term irrigation trial with 4 replicates. DDE and DDD are breakdown products of DDT and the units of the chemical’s concentration are parts per million (ppm). The data have been organised with the 8 plots (irrigated or dry land with 4 replicates of each) by the 3 chemicals in 24 columns. The column names consist of 3 characters, D or I for irrigation treatment, 1-4 for replicate and T, D, E for DDT, DDE, and DDT. The rows give the year and soil depths of measurements. To analyse this we need the years and plots in rows, and the chemicals in columns. We will take the mean over depths to give average level of chemical in the soil profile.
The file can be opened using the File | Open Example Data Sets menu.
Select the data file and click Open data.
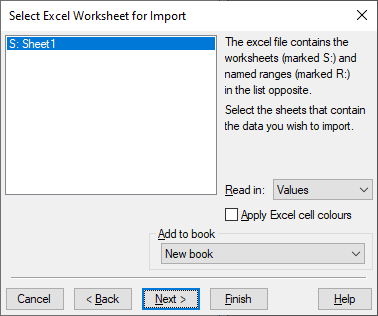
Now there is just one sheet in the data, so we click Next.
The first three rows contain heading information, and the column names are in row 4 so we specify a cell range of A4 and click Finish.
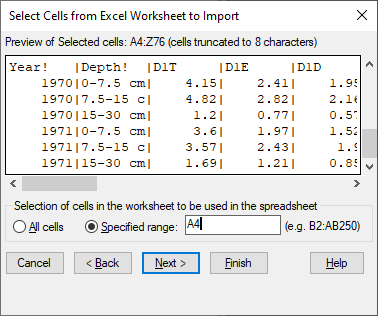
This gives the resulting spreadsheet below.
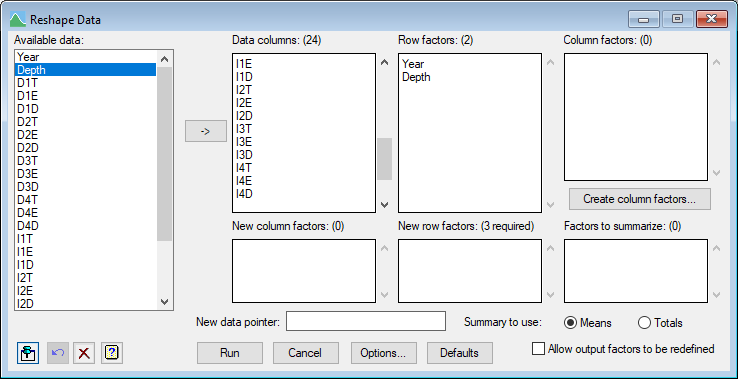
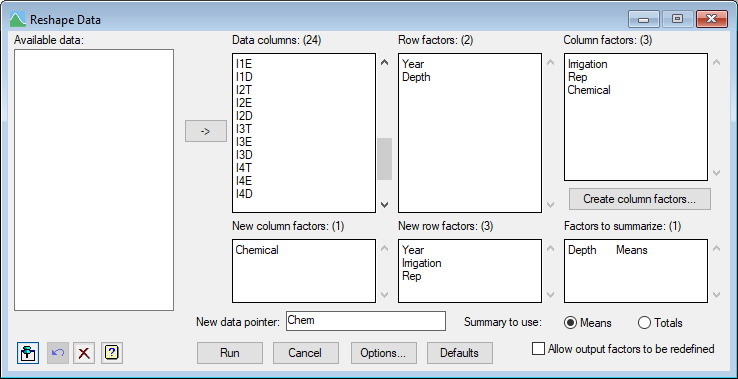
Now we open the Spread | Manipulation | Reshape menu and select the 24 columns D1T…I4D and click the arrow button ![]() to put these in the Data columns list. Click in the Row factors list and then double click Year and Depth in the Available data list, as show below.
to put these in the Data columns list. Click in the Row factors list and then double click Year and Depth in the Available data list, as show below.
To create column factors, we click the Create column factors button and get a spreadsheet containing the column names in C1 and two empty columns C2 and C3 (note column numbering may vary depending on how many prior spreadsheets have been opened).
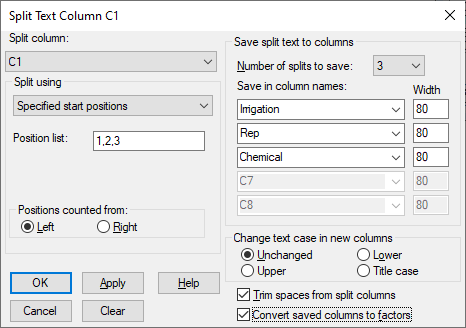
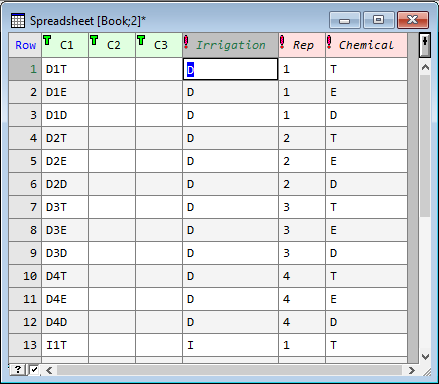
To extract the information in the names, we use the Spread | Calculate | Text Split menu and split the names at positions 1,2 and 3 into three columns Irrigation, Rep and Chemical giving the spreadsheet below. The two empty columns C2 and C3 are not used and can be ignored or deleted.
This adds the three columns to the column factor spreadsheet.
Now switching back to the Reshape menu, we specify the column factors by clicking in the Column factors list to give it the focus then double-click Irrigation, Rep and Chemical in the Available data list.
Now click in the New column factors list to give it the focus then double-click Chemical in the Available data.
Click in the New row factors list and double-click Year, Irrigation and Rep in the Available data list. Note the suffix _1 will be added to these names so the new columns don’t overwrite the old ones, unless you have ticked the option Allow output factors to be redefined.
Finally to average over the depths, we click in the Factors to summarize list and double-click Depth and specify Chem as the New data pointer.
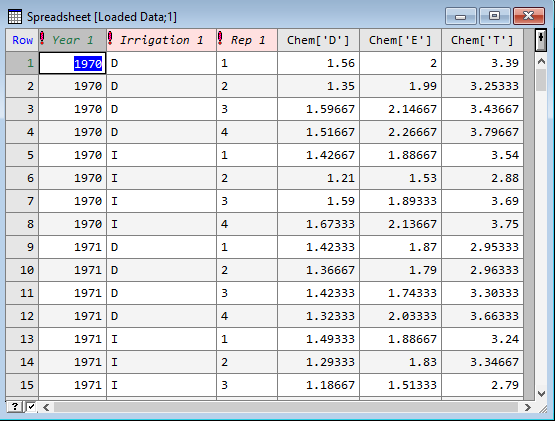
Now when we click Run, this gives the spreadsheet below with columns for year, irrigation, replicate and the three chemicals (Chem[‘T’],Chem[‘E’],Chem[‘D’]) averaged over depth.
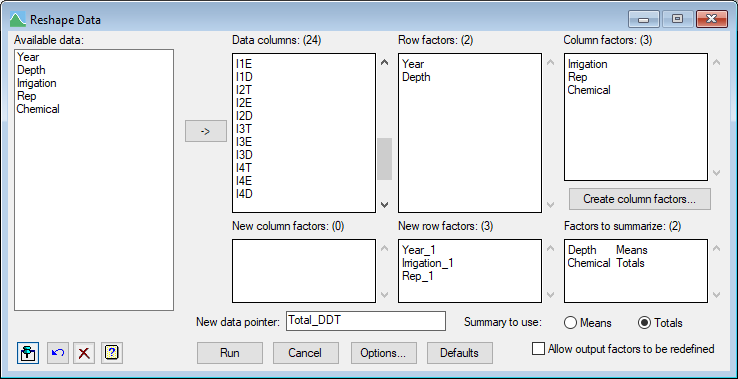
If we wanted the sum of the 3 chemicals, we could have selected the Summary to use Totals option before adding Chemical to the Factors to summarize list instead of adding it to the New column factors list as shown below.
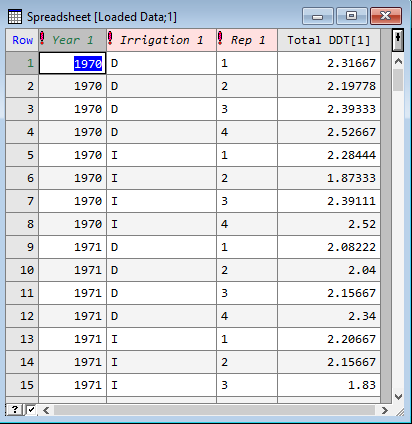
This gives the resulting spreadsheet below.
See also
- Options dialog
- Append menu
- Subset menu
- Data Menu
- RESHAPE procedure
- STACK procedure
- UNSTACK procedure