Use this to specify data for a Voronoi tessellation or Delaunay triangulation plot. This uses the TRIANGULATION procedure which produces an optimal tiling or triangular mesh between the points in the x-y plane. The tiles in the tessellation can be coloured to display the values of a third data variate as a colour spectrum. After you have selected the data, you can draw the graph by clicking Run. You can set additional options by clicking the Options, X Axis, Y Axis, Text Sizes and Fonts and Frame tabs.
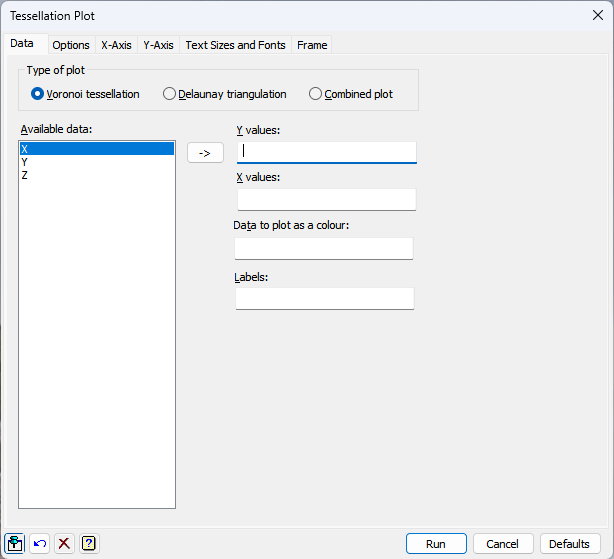
Type of plot
| Voronoi tessellation | Produce a Voronoi tessellation (also known as a Dirichlet tessellation) which creates polygons (tiles) around each point which contain the region of the plane closet to that point. |
| Delaunay triangulation | Produce a Delaunay triangulation which contains an optimal triangular mesh connecting the points to their closest neighbours. The mesh is optimized so that the resulting triangulation is as near uniformly equilateral as possible. |
| Combined plot | Produce a plot with the Delaunay triangulation superimposed on the Voronoi tessellation. |
Available data
This lists data structures appropriate to the current input field. It lists either variates, or texts for specifying the data. The contents may change as you move from one field to the next. Double-click a name to copy it to the current input field or type the name.
Y values
Specifies a variate giving the y-coordinates of the points to be plotted. Double-click a name in the Available data field to copy it across or type the name. You can also use the button to move a selected item to the field.
X values
Specifies a variate giving the x-coordinates of the points to be plotted. Double-click a name in the Available data field to copy it across or type the name. You can also use the button to move a selected item to the field.
Data to plot as a colour (Voronoi tessellation only)
Specifies an options variate to be plotted as colours. The values are mapped to colours given in the options using a linear mapping of the variates values to the colours. Double-click a name in the Available data field to copy it across or type the name. You can also use the button to move a selected item to the field.
Labels
Specifies optional labels to be plotted with the points defined by the x and y values. A text or variate can be used to specify the labels. Double-click a name in the Available data field to copy it across or type the name. You can also use the button to move a selected item to the field.
Action buttons
| Run | Produce the graph. |
| Cancel | Close the menu without further changes. |
| Defaults | Reset the options to their default settings. |
See also
- Tessellation Plot options tab menu
- X axis, Y axis, and Frame options
- Line and Symbols tab menu
- Key tab menu
- Text Sizes and Fonts options
- Graphics menus
- TRIANGULATION procedure