This lets you set attributes for the axis to control the appearance of the trellis plot. Use this to specify an overall title for the axis and to set the bounds and tick marks for all the sub-plots in the trellis plot simultaneously.
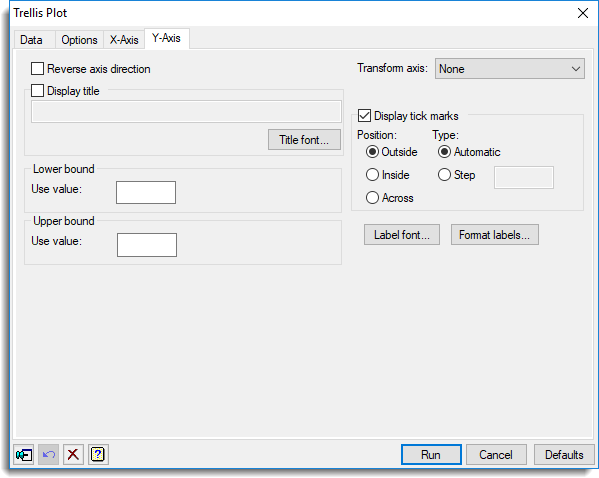
Reverse axis direction
By selecting this option you reverse the axis scale, so that high values are to the bottom and low values to the top.
Display title
Controls whether to display an overall title for the axis. If selected, you can enter the title for the axis in the space provided.
Title font
This opens the Edit Font dialog that lets you control the font for the title.
Bounds
Specifies the bounds for the axis. You can specify the Lower value and Upper value for the axis. If the lower value or upper value boxes are left blank then Genstat will derive a suitable axis bound from the data. You can set the lower value to a value greater than the upper value, to obtain a reversed data scale, but the bounds must not be equal.
Display tick marks
Controls whether tick marks are to be displayed. Select this to control the positioning and type of tick marks using the options provided.
Positions
Controls the positioning of the tick marks, which can be drawn on the inside, outside or across the axis.
| Outside | Draws the tickmarks towards the outside of the plot; that is below the axis if the axis is in the lower half of the plot, or above the axis if it is in the top half of the plot. The aim is then to position the tick marks away from the main part of the plot, so that they interfere with the plotted points as little as possible. |
| Inside | Draws the tick marks opposite side (to the inside of the plot). |
| Across | Draws the tick marks across the axis. |
Type
Controls how the tick marks are to be drawn. You can generate the tick marks automatically be selecting Automatic or you can specify the distance between each tick mark by selecting Step and entering the value into the space provided.
Label font
This opens the Edit Font dialog that lets you control the font for the axis labels.
Format labels
This opens the Format labels menu that lets you control the format for the axis labels.
Action buttons
| Run | Produce the graph. |
| Cancel | Close the dialog without further changes. |
| Defaults | Reset options to their default settings. |
See also
- Trellis plot data and options tab menus
- Edit font dialog
- Format labels dialog
- XAXIS and YAXIS directives