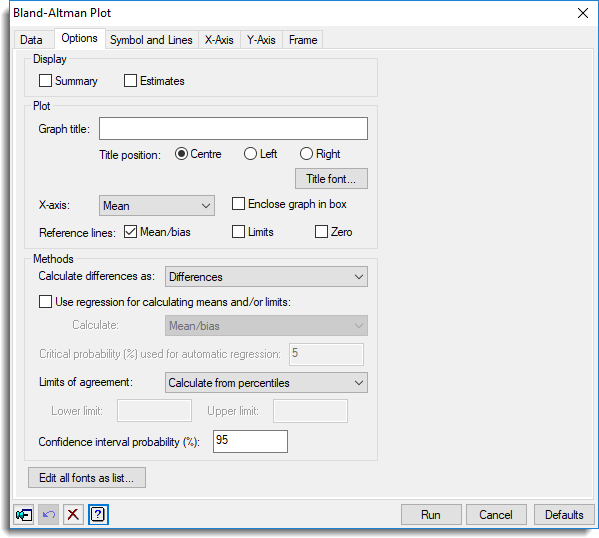
Use this to set attributes to control the output and appearance of the Bland-Altman plot. You can set the symbols and lines using the Symbol and Lines tab.
If you wish to look at the distribution of the differences, you could calculate these and then use the Probability Distribution Plot menu to do that.

Display
These options control what is displayed in the Output window.
| Summary | A summary showing the number and percentage of values above and below zero, and outside the limits of agreement. |
| Estimates | The estimates – if regression is being used, the estimates consist of the slope of the line, with its standard error and confidence interval, together with the sample size, otherwise, they consist of the mean difference, limits of agreement, standard error of the differences and the sample size. |
Graph title
Lets you enter a title for the graph. The title appears centred at the top of the graph.
Title position
You can position the title by selecting the Centre, Left or Right option.
Title font
This opens the Edit Font dialog that lets you control the font for the title.
X-axis
This controls what is used as the X-axis in the plot.
| Mean | The mean of two variates. |
| Variate 1 | The first variate as specified on the Data tab. |
| Variate 2 | The second variate as specified on the Data tab. |
Enclose graph in box
Select this to draw an enclosing box around the graph.
Reference lines
Selecting these options will add reference limits to the Bland-Altman plot.
| Mean/bias | A line at the overall mean of the differences . |
| Limits | Lines at upper and lower limits of agreement. |
| Zero | A horizontal line at zero, or one when Calculate difference as is set to Ratios. |
The colours and line styles of the reference lines can be set using the Symbol and Lines tab.
Calculate difference as
This option controls how the differences presented on the Y-axis are calculated.
| Differences | The differences between the two variates i.e. V1-V2 |
| Ratios | The ratios between the two variates i.e. V1/V2 |
| Percentage differences | The percentage differences between the two variates i.e. 100*(V1-V2)/((V1+V2)/2) |
Use regression for calculating means and/or limits
If this is selected, then the means/bias or limits of agreement can be estimated by regression. You can choose whether one or both of means/bias or limits are calculated by regression by using the Calculate dropdown list below.
| Mean/bias | Use regression to calculate the mean or bias but not the limits of agreement. |
| Limits | Use regression to calculate the limits of agreement but not the mean or bias. |
| Mean and limits | Use regression to calculate both the mean or bias and the limits of agreement. |
| Automatic for means and limits | Use regression to calculate the mean or bias and/or the limits of agreement, if the regressions are significant at the level given by the Critical probability (%). |
Critical probability (%) used for automatic regression
When the Automatic for means and limits setting has been selected for the Use regression for calculating means and/or limits option, this controls when regression is used: if either of the regressions for the means or limits are significant at the level of the critical probability, they will be used to calculate the mean and/or limits of agreement.
Limits of agreement
The limits of agreement are intended to represent boundaries on the acceptable difference between the methods. This specifies how the limits of agreement are calculated, if regression is not being used to calculate them, i.e. Use regression for calculating means and/or limits is not ticked.
| Normal | Uses confidence limits calculated assuming that the differences have a Normal distribution. The confidence limit probability to use is set using Confidence interval probability (%) |
| Percentiles | Take the percentiles of the differences. The percentiles to use are set using Confidence interval probability (%) field and if this is P, the percentiles are (1-P)/2 and (1+P)/2. |
| Specify lower and upper limits | Use the lower and upper limits of agreement specified in the Lower limit and Upper limit fields. |
Lower and upper limits
If Limits of agreement is set to Specify lower and upper limits, these fields provide a space to specify the lower and upper limits of agreement.
Confidence interval probability (%)
This specifies the confidence limits used to calculate the limits of agreement, if Limits of agreement is set to Normal. If Limits of agreement is set to Percentiles, this defines the percentiles to use. If this is has a value P, the percentiles used are (1-P)/2 and (1+P)/2.
Edit all fonts as a list
Clicking this opens the Edit All Fonts as a List dialog which allows all the fonts in the graph to be set in one place.
Action buttons
| Run | Produce the graph. |
| Cancel | Close the dialog without further changes. |
| Defaults | Reset options to their default settings. |
Action Icons
| Pin | Controls whether to keep the dialog open when you click Run. When the pin is down |
|
| Restore | Restore names into edit fields and default settings. | |
| Clear | Clear all fields and list boxes. | |
| Help | Open the Help topic for this dialog. |
See also
- Bland-Altman Plot data tab menu
- Bland-Altman Plot Symbol and Lines tab menu
- Y axis, X axis and Frame.
- Probability Distribution Plot menu for plotting distributions
- Edit font dialog
- Edit All Fonts as a List
- BLANDALTMAN procedure