Use this to set attributes to control the appearance of the 2D density graph.
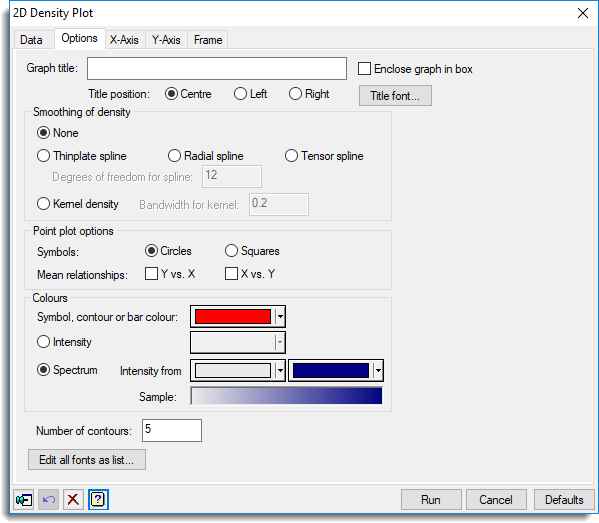
Graph title
Lets you enter a title for the graph. The title appears centred at the top of the graph.
Title position
You can position the title by selecting the Centre, Left or Right option.
Enclose graph in box
Select this to draw an enclosing box around the graph.
Title font
This opens the Edit Font dialog that lets you control the font for the title.
Smoothing of density
The densities can be smoothed to reduce the noise in the plot. In particular, this is useful to improve the display of contour or surface plots.
| None | No smoothing – the counts are used. |
| Thinplate spline | A 2-dimensional thinplate spline is fitted to the counts using the THINPLATE procedure. |
| Radial spline | A 2-dimensional radial spline is fitted to the counts using the RADIALSPLINE procedure. |
| Tensor spline | A 2-dimensional tensor spline is fitted to the counts using the TENSORSPLINE procedure. |
| Kernel | A 2-dimensional kernel smoother is fitted to the counts, using the Bandwidth specified for the normal kernel. The bandwidth must be between 0 and 1. A larger value gives a smoother result. |
The Degrees of freedom for spline option is used for the three spline smoothers, and specifies the number of knots used in both the x and y directions. This must be between 2 and 50. A smaller value gives a smoother result.
Point plot options
Select the Symbols to plot in a point plot (either Circles or Squares). The Mean relationships check boxes can be used to plot nonparametric smooths of either the means of the Y values for a given X value (Y vs. X) or the means of the X values for a given Y value (X vs. Y) as lines on the point plot.
Colours
These options let you control which colours are used when drawing the plots. The Symbol, contour or bar colour option lets you specify the colour of points in a point plot, the colour of the contour lines in a contour plot, or the colour of the bars in the histogram plot. The shading of the densities in a shade, contour or surface plot is given by the Intensity or Spectrum options. The Intensity option has different shades to appear in increasing intensity for the selected colour. Clicking the colour button allows you select a different colour. The Spectrum option lets you specify the different shades to appear in changing blends between two different colours. You can select the starting colour and ending colour using the two colour buttons. An example of the resulting colour range is shown in the Sample for the chosen options.
Number of contours
This gives the number of contour lines that will be plotted in the contour plot. This must be a positive integer.
Edit all fonts as a list
Clicking this opens the Edit All Fonts as a List menu which allows all the fonts in the graph to be set in one place.
Action buttons
| Run | Produce the graph. |
| Cancel | Close the dialog without further changes. |
| Defaults | Reset options to their default settings. |
Action Icons
| Pin | Controls whether to keep the dialog open when you click Run. When the pin is down |
|
| Restore | Restore names into edit fields and default settings. | |
| Clear | Clear all fields and list boxes. | |
| Help | Open the Help topic for this dialog. |
See also
- 2D density plot data tab menu
- Edit font dialog
- Edit All Fonts as a List
- DXYDENSITY procedure
- THINPLATE procedure
- RADIALSPLINE procedure
- TENSORSPLINE procedure