Use this to produce predictions of the values of the response variate at particular values of the variables in the fixed or random mixed models.
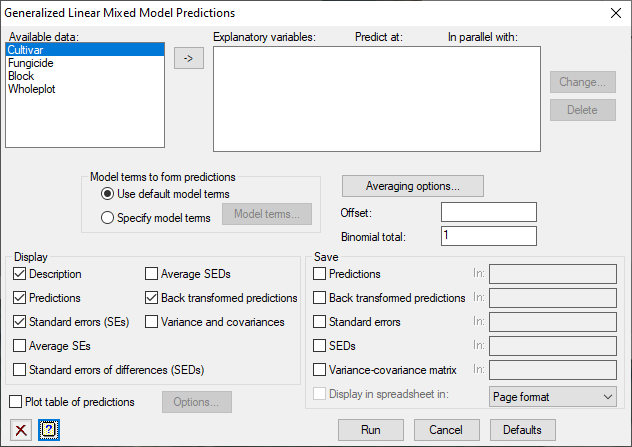
Available data
This lists the model terms which can be used to form predictions. Double-click a name to copy it to the Explanatory variable list. You can transfer multiple selections from Available data by holding the Ctrl key on your keyboard while selecting items, then click ![]() to move them all across in one action.
to move them all across in one action.
Explanatory variable list
This list contains all the variables that are to be used to form the predictions. The list contains three columns; variable name, values to predict at and the variable that it is parallel with. To change the prediction values for a variable in the list either double-click on the variable name or click on the Change values button.
Change values
This opens a submenu where you can change the values that are to be predicted for each of the variables listed in the Explanatory variable list.
Delete
This removes the currently selected variable from the Explanatory variable list.
Model terms for predictions
Controls which model terms (fixed and/or random) are to be used in forming the predictions. Select Use default model terms to use the default model terms (i.e. all the fixed terms and relevant random terms). Alternatively, select Specify model terms to specify the model terms to be used. The model terms must be specified by clicking on the Model terms button to open a submenu where the relevant model formula can be constructed.
Averaging options
Lets you specify additional averaging options to use when forming predictions.
Offset
Value of offset to use when calculating the means and back-transformed means; if this is not set a default value of 0 will be used.
Binomial total
Supplies the total number of trials to be used for prediction with a binomial distribution (providing a value n greater than one allows predictions to be made of the number of “successes” out of n, whereas the value one predicts the proportion of successes).
Display
Specifies the output to be displayed.
| Description | Describes the terms and standardization policies used when forming the predictions. |
| Predictions | Displays the predictions. |
| Standard errors (SEs) | Produces the standard errors of the predictions. |
| Average SE | Produces the average standard error of the predictions. |
| Standard errors of differences (SEDs) | Produces the standard errors for differences between the predictions. |
| Average SED | Produces the average standard error of differences between the predictions. |
| Back transformed predictions | Produces the predicted values back transformed to the original scale. |
| Variance and covariances | Produces the variance and covariances of the predictions. |
Save
This lets you save results from the prediction in Genstat data structures. After selecting the appropriate boxes, you need to type the names for the identifiers of the data structures into the corresponding In: fields.
| Predictions | Table or scalar | Contains the predictions |
| Back transformed predictions | Table or scalar | Contains the back transformed predictions |
| Standard errors | Table or scalar | Contains the standard errors of the predictions |
| SEDs | Symmetric matrix | Contains standard errors of differences between predictions |
| Variance-cov matrix | Symmetric matrix | Contains variances and covariances of predictions |
Display in spreadsheet
Select this to display the results in a new spreadsheet window. The format of the table of predictions and Back transformed predictions is controlled by the Format drop down list.
| Page format | Each table is displayed on a single page in a separate spreadsheet. The last specified classifying factor indexes the columns in the spreadsheet. |
| Column format | The tables occupy a single column but multiple tables can be put in a single spreadsheet. This is the default for a table with a single classifying factor. |
Plot table of predictions
If this is selected, the predictions will be plotted. The Options button opens the Plot table of predictions dialog which controls how the predictions are plotted. You need to complete the Explanatory variates list before using the Options button.
See also
- Generalized Linear Mixed Model menu.
- Generalized Linear Mixed Model Options dialog.
- Generalized Linear Mixed Model Save Options dialog.
- Generalized Linear Mixed Model Further Output dialog.
- Generalized Linear Mixed Model Permutation Test dialog.
- Generalized Linear Mixed Model Residual Plots dialog.
- GLPREDICT procedure in command mode for more options.
- GLMM procedure.
- GLDISPLAY procedure.
- GLPERMTEST procedure.
- GLPLOT procedure.
- GLKEEP procedure.