
Use this to set attributes to control the appearance of a shade plot.
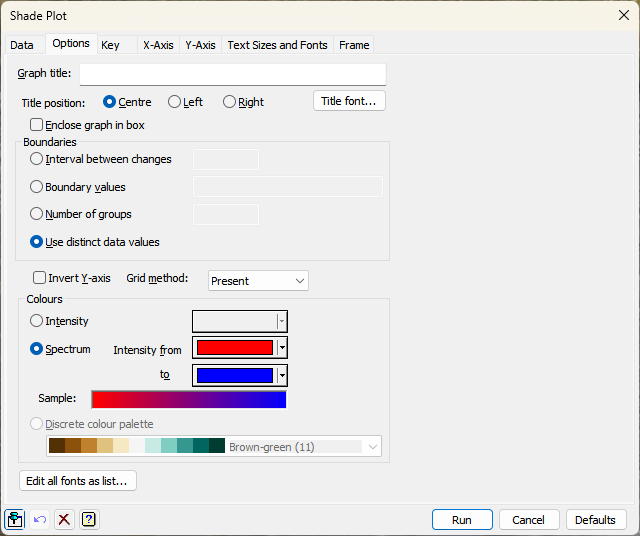
Graph title
Lets you enter a title for the graph. The title appears centred at the top of the graph.
Title position
You can position the title by selecting the Centre, Left or Right option.
Enclose graph in box
Select this to draw an enclosing box around the graph.
Title font
This opens the Edit Font menu that lets you control the font for the title.
Boundaries
Lets you define the boundaries for the data values for each shade. You can specify the boundaries of each of the shades by selecting Boundary values and entering a list of the values in the space provided. Similarly, you can specify the size of an interval for all the shades by selecting Interval between changes and entering the value into the space provided there. Alternatively, you can specify the exact number of shades by selecting Number of groups or let Genstat define the boundaries by selecting Use distinct data values. In this case Genstat uses a different shade for each distinct data value.
Invert Y-axis
This controls the orientation of the y-axis. Select this to reverse the y-axis, so that the grid is in the same order as it would be if it were printed.
Grid method
Controls whether an outline should be drawn around each element of the data grid. Select Present if you want to produce an outline for all values that are present; i.e. it ignores missing values. This is suitable where data have been sampled over an irregularly shaped area. Alternatively, select Complete to draw an outline around every element. If you do not want to draw any outlines, select None.
Colours
These options let you control the colours that are used when drawing the shade plot. The Colour between contours option lets you specify the different shades to appear in increasing intensity for a given colour. You can select the colour from the adjacent list. An example of the changing colour intensity is shown in the sample. The Spectrum option lets you specify the different shades to appear in changing intensity between two different colours. You can select the starting colour and ending colour from the adjacent lists. An example of the changing intensity is shown in the sample. Another option is for Discrete colour palette which can be selected from the drop down list of colour palettes. In this case, when Boundary values or Interval between changes are selected, you will need to specify the Number of intervals needed for the palette.
Edit all fonts as a list
Clicking this opens the Edit All Fonts as a List dialog which allows all the fonts in the graph to be set in one place.
Action buttons
| Run | Produce the graph. |
| Cancel | Close the dialog without further changes. |
| Defaults | Reset options to their default settings. |
See also
- Shade plot data tab menu
- Y axis, X axis and Frame options
- Text Sizes and Fonts options
- Key tab menu
- Edit font dialog
- Edit All Fonts as a List
- Graphics Menu
- DSHADE procedure