This is opened from the Sort Label/Level Order within a Factor Column dialog when the By summary statistic option is selected. This allows you to sort a factor’s levels using a variate’s summaries on the factor groups. This may be useful to change the order of the levels in a table or graph so that the groups are displayed in increasing or decreasing order of the selected statistic. You need to select a summary variate and statistic to be used for sorting the levels.
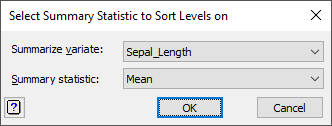
Summarize variate
Specifies a variate within the spreadsheet containing the data used to form the summary statistics.
Summary statistic
Select the summary statistic that you want to sort the factor levels on.
| Mean | Mean of the variate for each group |
| Median | Median value that divides each group of the variate into two equally sized sets |
| Minimum | Minimum value of the variate for each group |
| Maximum | Maximum value of the variate for each group |
| Standard deviation | Standard deviation of the variate for each group |
| Variance | Variance of the variate for each group |
| Standard error of the mean | Standard error of the mean of the variate for each group |
| Total | Total of the variate within groups |
| Number of observations | Number of observations of the variate within each group |
| Number of missing values | Number of missing values in the variate within each group |
Action buttons
| OK | Sort the factor levels using the calculated summary statistics. |
| Cancel | Close the menu without sorting the factor levels. |