Select menu: Stats | Survey Analysis | Multiple Summary Tables
This produces summaries of data values classified into different groups. The dialog allows multiple variates to be summarized, with a range of summary types, and with control of how these summary tables are put together for display. The tables of results can be indexed in a pointer, or combined into a single table with either the summaries as a single extra margin or, if a factorial combination of variates by statistics is given, with two margins, one for variates and the other for statistics.
- After you have imported your data, from the menu select
Stats | Survey Analysis | Multiple Summary Tables. - Fill in the fields as required then click Run.
You can save tables of results by clicking Store and specifying the names.

Available factors
This lists available factors. Double-click a name to copy it to the current input field that will take a factor (Classifying groups or the Names for factors indexing multiple responses).
Classifying groups
The groups are specified by one or more factors, each of which must have the same length as the data variate. The ![]() button allows multiple selections to be copied from Available factors list and
button allows multiple selections to be copied from Available factors list and  button removes selected factors from this list. Double-clicking an item in this also removes it from the list.
Set margins
Specifies whether the tables should include margins (summaries over all levels of each factor).
Weights
A variate specifying weights to be used in the tabulation.
Multi-response tables
Checking this enables two additional options for producing summaries of tables classified by multiple-response factors.
Pointers to factors defining multiple responses
A pointer to factors defining multiple responses in the table. You can form a pointer to factors for a multiple-response table using the form multiple-response factors menu. Separate the names with a space.
Names for factors for indexing multiple responses
Genstat generates an ordinary factor to classify each dimension of the table corresponding to multiple responses. You can specify names for these factors in the space provided. Separate the names with a space.
Available variates
This lists variate data structures that are the same length as the first factor in the Classifying groups list. Double-click a name to copy it to the current input field that will take a variate (Weights or the Summary list).
Form summaries list
This multi-column list displays the variate-summary combinations that have been specified. The list displays the Variate, Summary, % Margin and Decimals for the added summaries. The list can be added to by selecting 1 or more variates in the Available variates and using the ![]() button to add these to the list, using the current settings in the Form summaries field.
button to add these to the list, using the current settings in the Form summaries field.
You can also add a single variate by double-clicking it in the Available variates list. Double-clicking an item in the list opens the Multiple Summary Tables Attributes dialog so that its summary options can be edited. The summary options for selected items in the list can also be changed by choosing options in the Form summaries field and clicking the Apply button.
Right clicking on the list brings up a pop-up menu. The menu items Attributes, Remove item and Clear have the same function as the summary list action buttons with the same name below, apart from the extra menu item Expand to full combination set which for all the variates in the list creates the full set of summary statistics that are in the list, so that the full factorial combination of variates by summaries (with the exception of Counts) are present. For example, if the list contained 2 summaries, Mean of Income and Total of Hours, then using this option would add the extra summaries Mean of Hours and Total of Income, so that both variates (Income & Hours) had both summary statistics (Mean and Total).
Summary list action buttons
| Attributes | Opens the Multiple Summary Tables Attributes dialog to edit the attributes of the currently selected items in the summary list. |
| Up | Move the currently selected item up in the summary list. |
| Down | Move the currently selected item down in the summary list. |
| Remove | Remove the currently selected items in the summary list |
| Clear | Remove all the items in the summary list |
| Apply | Change the summary options of the selected items in the Summary list to the ones currently selected at the bottom of the Form summaries group field |
Summary
Check the statistics that you want to produce.
| Means | Mean of the sample for each group |
| Standard deviations | Standard deviation of the sample for each group |
| Medians | Median value that divides each grouped sample into two equally sized sets |
| Totals | Totals of values within groups |
| Number of observations | Number of observations within each group |
| Minima | Minimum value within each group |
| Maxima | Maximum value within each group |
| Variances | Variance of the samples for each group |
| Quantiles | A specified quantile of the samples for each group. Specify the quantiles required within the Quantile % field. |
| Skewness | Skewness of the samples for each group |
| Kurtosis | Kurtosis of the samples for each group |
| Standard error of mean | Standard error of mean of the samples for each group |
| Standard error of skewness | Standard error of skewness of the samples for each group |
| Standard error of kurtosis | Standard error of kurtosis of the samples for each group |
Quantile %
Specifies a percentage point for which the quantile will be calculated.
Decimals
Number of decimal places for numbers. If omitted, a default is determined which outputs the mean absolute value to 4 significant figures.
Display as percentage of margin
This allows the body of the table to be expressed as percentages of the corresponding values of the selected margin. The margin to be used as the denominator can be chosen by selecting the required set of factors from the dropdown list following the check box.
Display 100 in percentage margins
When a summary item has Display as % of margin selected and Set margins option is also selected, then this controls what numbers are put in the margins of the percentage tables. If this is selected, then 100 is put in the margins, otherwise the summary statistic used to divide the cells to create the percentages is put in the margins.
Add frequency counts
This includes a summary item Counts in the Form summaries list that gives the number of the samples in each group (including missing values). As this statistic does not have a variate associated with it, the column Variate in the list shows <none> for this item. Also, when using the Apply button, the Summary setting is ignored for Counts items, as you cannot change an item from Counts to another summary statistic or vice versa.
Display in output
Lets you display the results in the Output window.
Action buttons
| Run | Run tabulation of groups. |
| Cancel | Close the menu without further changes. |
| Defaults | Set the menu settings back to the default settings. Clicking the right mouse on this button produces a shortcut menu where you can choose to set the options using the currently stored defaults or the Genstat default settings. |
| Store | Change the options for saving the results using the Multiple Summary Tables Store Options dialog. This sets the structure name, type and whether the results are displayed in a spreadsheet or file, and the format of the spreadsheet or file. |
Action Icons
| Pin | Controls whether to keep the dialog open when you click Run. When the pin is down |
|
| Restore | Restore names into edit fields and default settings. | |
| Clear | Clear all fields and list boxes. | |
| Help | Open the Help topic for this dialog. |
Example
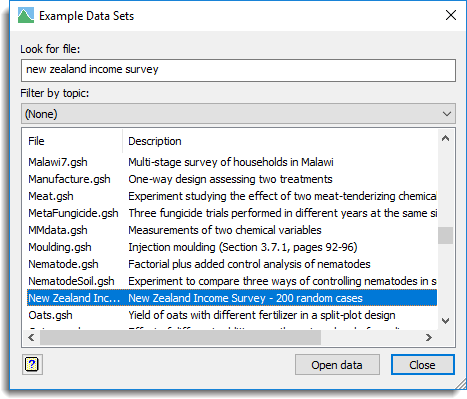
- Open the data set ‘New Zealand Income Survey.gsh‘ using the File | Open Example Data Sets menu as show below.
- From the menu select Stats | Survey Analysis | Multiple Summary Tables.
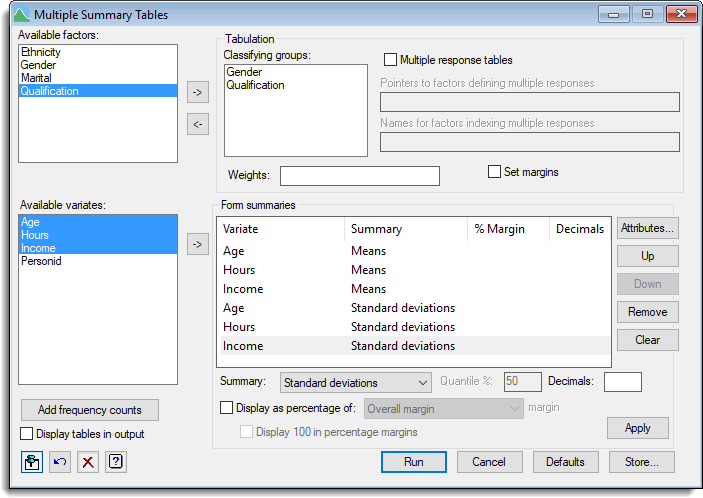
- Double click the factors Gender and Qualification to enter these in the Classifying groups list.
- Ensure that the Summary dropdown list is set to Means, then in the Available variates field hold down the Ctrl key and select the variates Age, Hours and Income then click
 to move them all across to the Form summaries field in one action.
 - In the Summary dropdown list select Standard deviations and click the button. The dialog should look like that below.
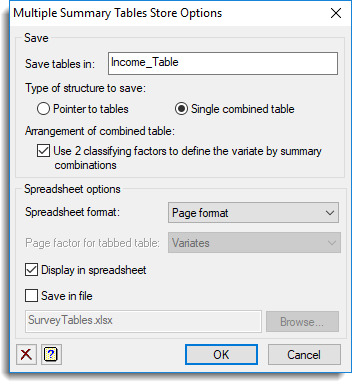
- Click the Store button to display the results in a spreadsheet.
- In the Save tables in field type Income_Table.
- Select the options Single combined table, Use 2 classifying factors to define the variate by summary combinations and Display in spreadsheet as shown below, and then click OK.
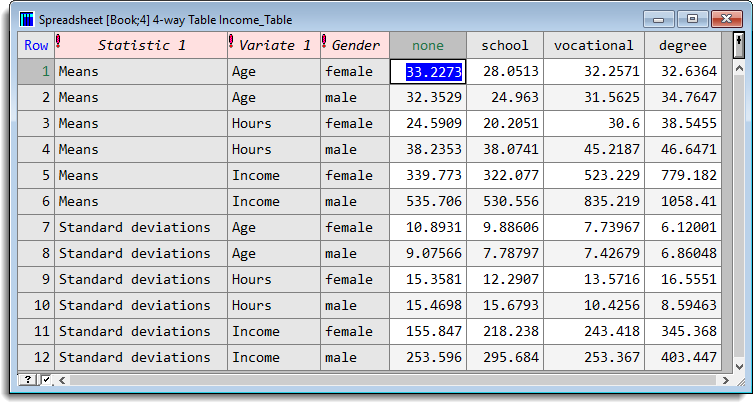
- Back on the main dialog, click Run to produce the spreadsheet below, as well as printing these results in the Output.
See also
- Multiple Summary Tables Attributes dialog
- Multiple Summary Tables Store Options dialog
- Summary Tables menu for displaying summary statistics of grouped data for a single variate
- Frequency tables menu
- Form multiple-response factors menu
- Summary statistics menu
- Chi-square goodness of fit
- Tabbed-tables
- Table Calculations
- Table Combine
- Table Slice
- Table Sort
- Table Examples