Select menu: Stats | Summary Statistics | Frequency Tables
This dialog produces frequency counts for grouped data. The data comes from one or more factors, and the frequency counts are then the number of units in each factor combination. You can also produce tables classified by multiple response factors.
- After you have imported your data, from the menu select
Stats | Summary Statistics | Frequency Tables.
OR
Stats | Survey Analysis | Frequency Tables. - Fill in the fields as required then click Run.
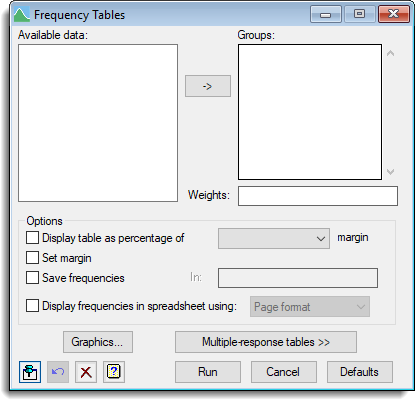
Available data
This lists data structures appropriate to the current input field. The contents will change as you move from one field to the next, displaying either variates or factors. Double-click a name to copy it to the current input field or type the name.
Groups
The groups are specified by one or more factors, each of which must have the same length. The ![]() button allows multiple selections to be copied from Available data.
button allows multiple selections to be copied from Available data.
Weights
A variate specifying weights to be used in the tabulation.
Display table as percentage of margin
This allows the body of the table to be expressed as percentages of the corresponding values of the selected margin. Select the required factor from the dropdown list to specify the margin to be used as the denominator list.
Set margin
Specifies whether the tables should include margins (counts over all levels of each factor).
Save frequencies
Lets you save the frequency counts into a table data structure.
Display frequencies in a spreadsheet
When selected the table of frequency counts will be displayed within a spreadsheet. The format of the spreadsheet can be controlled by the choices in the dropdown list.
| Page Format | Each table is displayed on a single page in a separate spreadsheet. The last specified classifying factor indexes the columns in the spreadsheet. |
| Parallel Format | The tables occupy a single column but multiple tables can be put in a single spreadsheet. This is the default for a table with a single classifying factor. |
| Tabbed Format | For a table with three or more classifying factors, the table will be displayed as a tabbed-table with the first classifying factor’s groups indexing the tabs in the book. |
Graphics
Opens a menu which can be used to plot the table currently specified by the factors in the Graphics list.
Multiple-response tables
Displays two additional options for producing frequency count tables classified by multiple response factors. For more details on multiple response factors see Form Multiple-Response Factors.
Pointer to factors defining multiple-responses
A pointer to factors defining the multiple responses in the table. You can form a pointer to factors for a multiple-response table using Form Multiple-Response Factors.
Name for factors to index multiple responses
This generates an ordinary factor to classify the dimension of the table corresponding to the multiple responses. You can specify identifier names for these factors in the space provided.
Action Icons
| Pin | Controls whether to keep the dialog open when you click Run. When the pin is down |
|
| Restore | Restore names into edit fields and default settings. | |
| Clear | Clear all fields and list boxes. | |
| Help | Open the Help topic for this dialog. |